GE 2011 Annual Report Download - page 117
Download and view the complete annual report
Please find page 117 of the 2011 GE annual report below. You can navigate through the pages in the report by either clicking on the pages listed below, or by using the keyword search tool below to find specific information within the annual report.-
 1
1 -
2
-
3
-
4
-
5
-
6
-
7
-
8
-
9
-
10
-
11
-
12
-
13
-
14
-
15
-
16
-
17
-
18
-
19
-
20
-
21
-
22
-
23
-
24
-
25
-
26
-
27
-
28
-
29
-
30
-
31
-
32
-
33
-
34
-
35
-
36
-
37
-
38
-
39
-
40
-
41
-
42
-
43
-
44
-
45
-
46
-
47
-
48
-
49
-
50
-
51
-
52
-
53
-
54
-
55
-
56
-
57
-
58
-
59
-
60
-
61
-
62
-
63
-
64
-
65
-
66
-
67
-
68
-
69
-
70
-
71
-
72
-
73
-
74
-
75
-
76
-
77
-
78
-
79
-
80
-
81
-
82
-
83
-
84
-
85
-
86
-
87
-
88
-
89
-
90
-
91
-
92
-
93
-
94
-
95
-
96
-
97
-
98
-
99
-
100
-
101
-
102
-
103
-
104
-
105
-
106
-
 107
107 -
 108
108 -
 109
109 -
 110
110 -
 111
111 -
 112
112 -
 113
113 -
 114
114 -
 115
115 -
 116
116 -
 117
117 -
 118
118 -
 119
119 -
 120
120 -
 121
121 -
 122
122 -
 123
123 -
 124
124 -
 125
125 -
 126
126 -
 127
127 -
128
-
129
-
130
-
131
-
132
-
133
-
134
-
135
-
136
-
137
-
138
-
139
-
140
-
141
-
142
-
143
-
144
-
145
-
146
 |
 |

GE 2011 ANNUAL REPORT 115
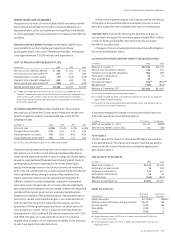
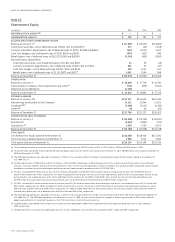
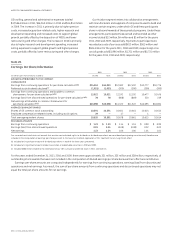
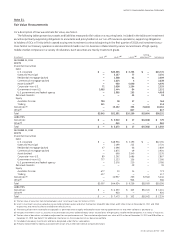
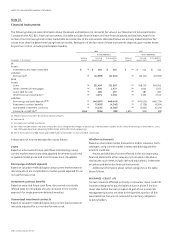
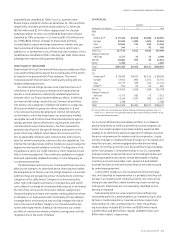
Note 21.
Fair Value Measurements
For a description of how we estimate fair value, see Note 1.
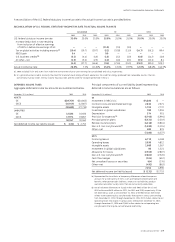
The following tables present our assets and liabilities measured at fair value on a recurring basis. Included in the tables are investment
securities primarily supporting obligations to annuitants and policyholders in our run-off insurance operations, supporting obligations
to holders of GICs in Trinity (which ceased issuing new investment contracts beginning in the fi rst quarter of 2010) and investment secu-
rities held at our treasury operations and investments held in our CLL business collateralized by senior secured loans of high-quality,
middle-market companies in a variety of industries. Such securities are mainly investment grade.
(In millions) Level 1 (a) Level 2 (a) Level 3 (b) Netting
adjustment (c) Net balance
DECEMBER 31, 2011
ASSETS
Investment securities
Debt
U.S. corporate $ — $20,535 $ 3,235 $ — $23,770
State and municipal — 3,157 77 — 3,234
Residential mortgage-backed — 2,568 41 — 2,609
Commercial mortgage-backed — 2,824 4 — 2,828
Asset-backed (d) — 930 4,040 — 4,970
Corporate—non-U.S. 71 1,058 1,204 — 2,333
Government—non-U.S. 1,003 1,444 84 — 2,531
U.S. government and federal agency — 3,805 253 — 4,058
Retained interests — — 35 — 35
Equity
Available-for-sale 730 18 17 — 765
Trading 241 — — — 241
Derivatives (e) — 15,252 393 (5,604) 10,041
Other (f) — — 817 — 817
Total $2,045 $51,591 $10,200 $(5,604) $58,232
LIABILITIES
Derivatives $ — $ 5,010 $ 27 $(4,308) $ 729
Other (g) — 863 — — 863
Total $ — $ 5,873 $ 27 $(4,308) $ 1,592
DECEMBER 31, 2010
ASSETS
Investment securities
Debt
U.S. corporate $ — $18,956 $ 3,199 $ — $22,155
State and municipal — 2,499 225 — 2,724
Residential mortgage-backed 47 2,696 66 — 2,809
Commercial mortgage-backed — 2,875 49 — 2,924
Asset-backed — 690 2,540 — 3,230
Corporate—non-U.S. 89 1,292 1,486 — 2,867
Government—non-U.S. 777 1,333 156 — 2,266
U.S. government and federal agency — 3,576 210 — 3,786
Retained interests — — 39 — 39
Equity
Available-for-sale 677 20 24 — 721
Trading 417 — — — 417
Derivatives (e) — 10,997 359 (5,910) 5,446
Other (f) — — 906 — 906
Total $2,007 $44,934 $ 9,259 $(5,910) $50,290
LIABILITIES
Derivatives $ — $ 6,553 $ 103 $(5,242) $ 1,414
Other (g) — 920 — — 920
Total $ — $ 7,473 $ 103 $(5,242) $ 2,334
(a) The fair value of securities transferred between Level 1 and Level 2 was $67 million in 2011.
(b) Level 3 investment securities valued using non-binding broker quotes and other third parties totaled $2,386 million and $1,054 million at December 31, 2011 and 2010,
respectively, and were classified as available-for-sale securities.
(c) The netting of derivative receivables and payables is permitted when a legally enforceable master netting agreement exists and when collateral is posted to us.
(d) Includes investments in our CLL business in asset-backed securities collateralized by senior secured loans of high-quality, middle-market companies in a variety of industries.
(e) The fair value of derivatives included an adjustment for non-performance risk. The cumulative adjustment was a loss of $13 million at December 31, 2011 and $10 million at
December 31, 2010. See Note 22 for additional information on the composition of our derivative portfolio.
(f) Included private equity investments and loans designated under the fair value option.
(g) Primarily represented the liability associated with certain of our deferred incentive compensation plans.