GE 2011 Annual Report Download - page 92
Download and view the complete annual report
Please find page 92 of the 2011 GE annual report below. You can navigate through the pages in the report by either clicking on the pages listed below, or by using the keyword search tool below to find specific information within the annual report.-
 1
1 -
2
-
3
-
4
-
5
-
6
-
7
-
8
-
9
-
10
-
11
-
12
-
13
-
14
-
15
-
16
-
17
-
18
-
19
-
20
-
21
-
22
-
23
-
24
-
25
-
26
-
27
-
28
-
29
-
30
-
31
-
32
-
33
-
34
-
35
-
36
-
37
-
38
-
39
-
40
-
41
-
42
-
43
-
44
-
45
-
46
-
47
-
48
-
49
-
50
-
51
-
52
-
53
-
54
-
55
-
56
-
57
-
58
-
59
-
60
-
61
-
62
-
63
-
64
-
65
-
66
-
67
-
68
-
69
-
70
-
71
-
72
-
73
-
74
-
75
-
76
-
77
-
78
-
79
-
80
-
81
-
 82
82 -
 83
83 -
 84
84 -
 85
85 -
 86
86 -
 87
87 -
 88
88 -
 89
89 -
 90
90 -
 91
91 -
 92
92 -
 93
93 -
 94
94 -
 95
95 -
 96
96 -
 97
97 -
 98
98 -
 99
99 -
 100
100 -
 101
101 -
 102
102 -
103
-
104
-
105
-
106
-
107
-
108
-
109
-
110
-
111
-
112
-
113
-
114
-
115
-
116
-
117
-
118
-
119
-
120
-
121
-
122
-
123
-
124
-
125
-
126
-
127
-
128
-
129
-
130
-
131
-
132
-
133
-
134
-
135
-
136
-
137
-
138
-
139
-
140
-
141
-
142
-
143
-
144
-
145
-
146
 |
 |
90 GE 2011 ANNUAL REPORT
We regularly review investment securities for impairment using
both qualitative and quantitative criteria. We presently do not
intend to sell the vast majority of our debt securities and believe
that it is not more likely than not that we will be required to sell
these securities that are in an unrealized loss position before
recovery of our amortized cost. We believe that the unrealized
loss associated with our equity securities will be recovered within
the foreseeable future.
The vast majority of our U.S. corporate debt securities are
rated investment grade by the major rating agencies. We evaluate
U.S. corporate debt securities based on a variety of factors, such
as the fi nancial health of and specifi c prospects for the issuer,
including whether the issuer is in compliance with the terms and
covenants of the security. In the event a U.S. corporate debt secu-
rity is deemed to be other-than-temporarily impaired, we isolate
the credit portion of the impairment by comparing the present
value of our expectation of cash fl ows to the amortized cost of
the security. We discount the cash fl ows using the original effec-
tive interest rate of the security.
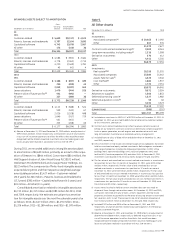
The vast majority of our RMBS have investment grade credit
ratings from the major rating agencies and are in a senior posi-
tion in the capital structure of the deal. Of our total RMBS at
December 31, 2011 and 2010, approximately $515 million and
$673 million, respectively, relate to residential subprime credit,
primarily supporting our guaranteed investment contracts. These
are collateralized primarily by pools of individual, direct mortgage
loans (a majority of which were originated in 2006 and 2005), not
other structured products such as collateralized debt obligations.
In addition, of the total residential subprime credit exposure at
December 31, 2011 and 2010, approximately $277 million and
$343 million, respectively, was insured by Monoline insurers
(Monolines) on which we continue to place reliance.
Our commercial mortgage-backed securities (CMBS) portfo-
lio is collateralized by both diversifi ed pools of mortgages that
were originated for securitization (conduit CMBS) and pools of
large loans backed by high-quality properties (large loan CMBS), a
majority of which were originated in 2006 and 2007. Substantially
all of the securities in our CMBS portfolio have investment grade
credit ratings and the vast majority of the securities are in a senior
position in the capital structure.
Our asset-backed securities (ABS) portfolio is collateralized by
senior secured loans of high-quality, middle-market companies
in a variety of industries, as well as a variety of diversifi ed pools of
assets such as student loans and credit cards. The vast majority
of our ABS are in a senior position in the capital structure of the
deals. In addition, substantially all of the securities that are below
investment grade are in an unrealized gain position.
For ABS and RMBS, we estimate the portion of loss attribut-
able to credit using a discounted cash fl ow model that considers
estimates of cash fl ows generated from the underlying collateral.
Estimates of cash fl ows consider credit risk, interest rate and
prepayment assumptions that incorporate management’s best
estimate of key assumptions of the underlying collateral, includ-
ing default rates, loss severity and prepayment rates. For CMBS,
we estimate the portion of loss attributable to credit by evalu-
ating potential losses on each of the underlying loans in the
security. Collateral cash fl ows are considered in the context of
our position in the capital structure of the deals. Assumptions can
vary widely depending upon the collateral type, geographic con-
centrations and vintage.
If there has been an adverse change in cash fl ows for RMBS,
management considers credit enhancements such as monoline
insurance (which are features of a specifi c security). In evaluating
the overall credit worthiness of the Monoline, we use an analy-
sis that is similar to the approach we use for corporate bonds,
including an evaluation of the suffi ciency of the Monoline’s cash
reserves and capital, ratings activity, whether the Monoline is in
default or default appears imminent, and the potential for inter-
vention by an insurance or other regulator.
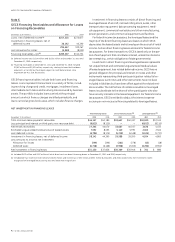
During 2011, we recorded pre-tax, other-than-temporary
impairments of $467 million, of which $387 million was recorded
through earnings ($81 million relates to equity securities) and
$80 million was recorded in accumulated other comprehensive
income (AOCI). At January 1, 2011, cumulative impairments rec-
ognized in earnings associated with debt securities still held were
$500 million. During 2011, we recognized fi rst-time impairments
of $58 million and incremental charges on previously impaired
securities of $230 million. These amounts included $62 million
related to securities that were subsequently sold.
During 2010, we recorded pre-tax, other-than-temporary
impairments of $460 million, of which $253 million was recorded
through earnings ($35 million relates to equity securities) and
$207 million was recorded in AOCI. At January 1, 2010, cumulative
impairments recognized in earnings associated with debt securities
still held were $340 million. During 2010, we recognized fi rst-time
impairments of $164 million and incremental charges on previously
impaired securities of $38 million. These amounts included $41 mil-
lion related to securities that were subsequently sold.
During 2009, we recorded pre-tax, other-than-temporary
impairments of $1,078 million, of which $753 million was
recorded through earnings ($42 million relates to equity secu-
rities) and $325 million was recorded in AOCI. At April 1, 2009,
$33 million was reclassifi ed to retained earnings as a result of
the amendments to ASC 320. Subsequent to April 1, 2009, fi rst-
time and incremental credit impairments were $109 million and
$257 million, respectively. Previous credit impairments related to
securities sold were $124 million.