GE 2011 Annual Report Download - page 119
Download and view the complete annual report
Please find page 119 of the 2011 GE annual report below. You can navigate through the pages in the report by either clicking on the pages listed below, or by using the keyword search tool below to find specific information within the annual report.-
 1
1 -
2
-
3
-
4
-
5
-
6
-
7
-
8
-
9
-
10
-
11
-
12
-
13
-
14
-
15
-
16
-
17
-
18
-
19
-
20
-
21
-
22
-
23
-
24
-
25
-
26
-
27
-
28
-
29
-
30
-
31
-
32
-
33
-
34
-
35
-
36
-
37
-
38
-
39
-
40
-
41
-
42
-
43
-
44
-
45
-
46
-
47
-
48
-
49
-
50
-
51
-
52
-
53
-
54
-
55
-
56
-
57
-
58
-
59
-
60
-
61
-
62
-
63
-
64
-
65
-
66
-
67
-
68
-
69
-
70
-
71
-
72
-
73
-
74
-
75
-
76
-
77
-
78
-
79
-
80
-
81
-
82
-
83
-
84
-
85
-
86
-
87
-
88
-
89
-
90
-
91
-
92
-
93
-
94
-
95
-
96
-
97
-
98
-
99
-
100
-
101
-
102
-
103
-
104
-
105
-
106
-
107
-
108
-
 109
109 -
 110
110 -
 111
111 -
 112
112 -
 113
113 -
 114
114 -
 115
115 -
 116
116 -
 117
117 -
 118
118 -
 119
119 -
 120
120 -
 121
121 -
 122
122 -
 123
123 -
 124
124 -
 125
125 -
 126
126 -
 127
127 -
 128
128 -
 129
129 -
130
-
131
-
132
-
133
-
134
-
135
-
136
-
137
-
138
-
139
-
140
-
141
-
142
-
143
-
144
-
145
-
146
 |
 |

GE 2011 ANNUAL REPORT 117
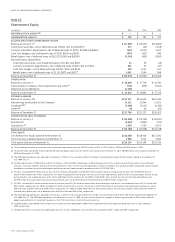
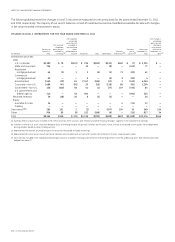
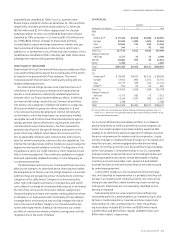
CHANGES IN LEVEL 3 INSTRUMENTS FOR THE YEAR ENDED DECEMBER 31, 2010
(In millions)
Balance at
January 1,
2010 (a)
Net realized/
unrealized
gains (losses)
included in
earnings (b)
Net realized/
unrealized
gains (losses)
included in
accumulated
other
comprehensive
income
Purchases,
Issuances and
Settlements
Transfers in
and/or out
of Level 3 (c)
Balance at
December 31,
2010
Net change in
unrealized
gains (losses)
relating to
instruments
still held at
December 31,
2010 (d)
Investment securities
Debt
U.S. corporate $3,068 $ 79 $276 $ (215) $ (9) $3,199 $ —
State and municipal 205 — 25 (5) — 225 —
Residential mortgage-backed 123 (1) 13 2 (71) 66 —
Commercial mortgage-backed 1,041 30 (2) (1,017) (3) 49 —
Asset-backed 1,872 25 14 733 (104) 2,540 —
Corporate—non-U.S. 1,331 (38) (39) 250 (18) 1,486 —
Government—non-U.S. 163 — (8) — 1 156 —
U.S. government and federal agency 256 — (44) (2) — 210 —
Retained interests 45 (1) 3 (8) — 39 —
Equity
Available-for-sale 19 — 3 — 2 24 1
Trading ———————
Derivatives (e)(f) 236 220 15 (79) (127) 265 41
Other 891 5 (30) 40 — 906 3
Total $9,250 $319 $226 $ (301) $(329) $9,165 $45
(a) Included $1,015 million in debt securities, a reduction in retained interests of $8,782 million and a reduction in derivatives of $365 million related to adoption of ASU 2009-16 & 17.
(b) Earnings effects are primarily included in the “GECS revenues from services” and “Interest and other financial charges” captions in the Statement of Earnings.
(c) Transfers in and out of Level 3 are considered to occur at the beginning of the period. Transfers out of Level 3 were a result of increased use of quotes from independent
pricing vendors based on recent trading activity.
(d) Represented the amount of unrealized gains or losses for the period included in earnings.
(e) Represented derivative assets net of derivative liabilities and included cash accruals of $9 million not reflected in the fair value hierarchy table.
(f) Gains (losses) included in net realized/unrealized gains (losses) included in earnings were offset by the earnings effects from the underlying items that were
economically hedged. See Note 22.
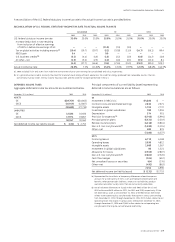
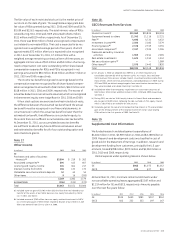
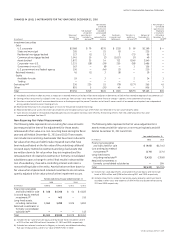
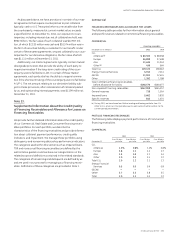
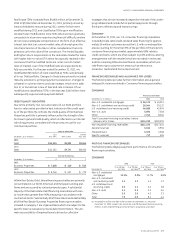
Non-Recurring Fair Value Measurements
The following table represents non-recurring fair value amounts
(as measured at the time of the adjustment) for those assets
remeasured to fair value on a non-recurring basis during the fi scal
year and still held at December 31, 2011 and 2010. These assets
can include loans and long-lived assets that have been reduced to
fair value when they are held for sale, impaired loans that have
been reduced based on the fair value of the underlying collateral,
cost and equity method investments and long-lived assets that
are written down to fair value when they are impaired and the
remeasurement of retained investments in formerly consolidated
subsidiaries upon a change in control that results in deconsolida-
tion of a subsidiary, if we sell a controlling interest and retain a
noncontrolling stake in the entity. Assets that are written down to
fair value when impaired and retained investments are not subse-
quently adjusted to fair value unless further impairment occurs.
Remeasured during the year ended December 31
2011 2010
(In millions) Level 2 Level 3 Level 2 Level 3
Financing receivables
and loans held for sale $ 158 $5,348 $ 54 $ 6,833
Cost and equity method
investments (a) — 403 — 510
Long-lived assets,
including real estate 1,343 3,288 1,025 5,811
Retained investments in
formerly consolidated
subsidiaries (b) ——— 113
Total $1,501 $9,039 $1,079 $13,267
(a) Includes the fair value of private equity and real estate funds included in Level 3
of $123 million and $296 million at December 31, 2011 and 2010, respectively.
(b) Excluded our retained investment in Regency, a formerly consolidated subsidiary,
that was remeasured to a Level 1 fair value of $549 million in 2010.
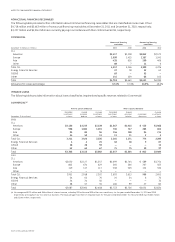
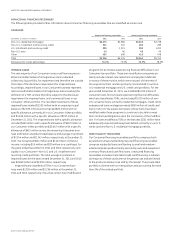
The following table represents the fair value adjustments to
assets measured at fair value on a non-recurring basis and still
held at December 31, 2011 and 2010.
Year ended December 31
(In millions) 2011 2010
Financing receivables
and loans held for sale $ (925) $(1,745)
Cost and equity method
investments (a) (274) (274)
Long-lived assets,
including real estate (b) (1,431) (2,958)
Retained investments in
formerly consolidated subsidiaries —184
Total $(2,630) $(4,793)
(a) Includes fair value adjustments associated with private equity and real estate
funds of $(24) million and $(198) million during 2011 and 2010, respectively.
(b) Includes impairments related to real estate equity properties and investments
recorded in other costs and expenses of $976 million and $2,089 million during
2011 and 2010, respectively.