GE 2011 Annual Report Download - page 49
Download and view the complete annual report
Please find page 49 of the 2011 GE annual report below. You can navigate through the pages in the report by either clicking on the pages listed below, or by using the keyword search tool below to find specific information within the annual report.-
 1
1 -
2
-
3
-
4
-
5
-
6
-
7
-
8
-
9
-
10
-
11
-
12
-
13
-
14
-
15
-
16
-
17
-
18
-
19
-
20
-
21
-
22
-
23
-
24
-
25
-
26
-
27
-
28
-
29
-
30
-
31
-
32
-
33
-
34
-
35
-
36
-
37
-
38
-
 39
39 -
 40
40 -
 41
41 -
 42
42 -
 43
43 -
 44
44 -
 45
45 -
 46
46 -
 47
47 -
 48
48 -
 49
49 -
 50
50 -
 51
51 -
 52
52 -
 53
53 -
 54
54 -
 55
55 -
 56
56 -
 57
57 -
 58
58 -
 59
59 -
60
-
61
-
62
-
63
-
64
-
65
-
66
-
67
-
68
-
69
-
70
-
71
-
72
-
73
-
74
-
75
-
76
-
77
-
78
-
79
-
80
-
81
-
82
-
83
-
84
-
85
-
86
-
87
-
88
-
89
-
90
-
91
-
92
-
93
-
94
-
95
-
96
-
97
-
98
-
99
-
100
-
101
-
102
-
103
-
104
-
105
-
106
-
107
-
108
-
109
-
110
-
111
-
112
-
113
-
114
-
115
-
116
-
117
-
118
-
119
-
120
-
121
-
122
-
123
-
124
-
125
-
126
-
127
-
128
-
129
-
130
-
131
-
132
-
133
-
134
-
135
-
136
-
137
-
138
-
139
-
140
-
141
-
142
-
143
-
144
-
145
-
146
 |
 |

’
GE 2011 ANNUAL REPORT 47
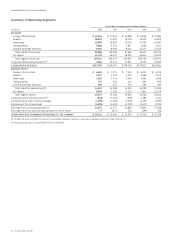
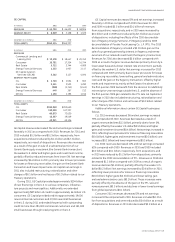
Corporate items and eliminations revenues of $7.6 billion in 2011
decreased $11.5 billion as a $14.9 billion reduction in revenues
from NBCU LLC operations resulting from the deconsolidation of
NBCU effective January 28, 2011 and $0.3 billion of lower rev-
enues from other disposed businesses were partially offset by a
$3.7 billion pre-tax gain related to the NBCU transaction.
Corporate items and eliminations costs decreased by $0.7 billion
as $3.6 billion of higher gains from disposed businesses, primarily
the NBCU transaction, and a $0.6 billion decrease in restructuring,
rationalization, acquisition-related and other charges were par-
tially offset by $1.4 billion of higher costs of our principal
retirement plans, $1.4 billion of lower earnings from NBCU/NBCU
LLC operations and a $0.6 billion increase in research and devel-
opment spending and global corporate costs.
Certain amounts included in Corporate items and eliminations
cost are not allocated to GE operating segments because they are
excluded from the measurement of their operating performance
for internal purposes. For 2011, these included $0.4 billion at
Energy Infrastructure for acquisition-related costs and $0.4 billion
at Healthcare, $0.3 billion at Energy Infrastructure, $0.2 billion at
Aviation and $0.1 billion at both Home & Business Solutions and
Transportation, primarily for technology and product develop-
ment costs and restructuring, rationalization and other charges.
In 2011, underabsorbed corporate overhead and other costs
was fl at compared with 2010, as increased costs at our global
research centers and global corporate costs were offset by lower
restructuring and other charges (including acquisition-related
costs) of $0.6 billion. In 2010, underabsorbed corporate overhead
and other costs increased by $0.1 billion as compared with 2009,
as increased costs at our global research centers and staff costs
and lower income from operations of disposed businesses were
partially offset by lower restructuring and other charges (includ-
ing environmental remediation costs related to the Hudson River
dredging project) of $0.6 billion.
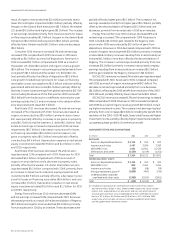
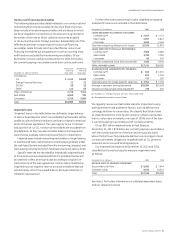
DISCONTINUED OPERATIONS
(In millions) 2011 2010 2009
Earnings (loss) from discontinued
operations, net of taxes $77 $(873) $219
Discontinued operations primarily comprised BAC, GE Money
Japan, WMC, Consumer RV Marine, Consumer Mexico, Consumer
Singapore and Australian Home Lending. Associated results of
operations, fi nancial position and cash fl ows are separately
reported as discontinued operations for all periods presented.
In 2011, earnings from discontinued operations, net of taxes,
included a $0.3 billion gain related to the sale of Consumer
Singapore and earnings from operations at Australian Home
Lending of $0.1 billion, partially offset by incremental reserves for
excess interest claims related to our loss-sharing arrangement
on the 2008 sale of GE Money Japan of $0.2 billion and the loss on
the sale of Australian Home Lending of $0.1 billion.
In 2010, loss from discontinued operations, net of taxes, primar-
ily refl ected incremental reserves for excess interest claims related
to our loss-sharing arrangement on the 2008 sale of GE Money
Japan of $1.7 billion and estimated after-tax losses of $0.2 billion
and $0.1 billion on the planned sales of Consumer Mexico and
Consumer RV Marine, respectively, partially offset by an after-tax
gain on the sale of BAC of $0.8 billion and earnings from operations
at Consumer Mexico of $0.2 billion and at BAC of $0.1 billion.
In 2009, earnings from discontinued operations, net of taxes,
primarily refl ected earnings from operations of BAC of $0.3 billion,
Australian Home Lending of $0.1 billion and Consumer Mexico
of $0.1 billion, partially offset by incremental reserves for excess
interest claims related to our loss-sharing arrangement on the
2008 sale of GE Money Japan of $0.2 billion and loss from opera-
tions at Consumer RV Marine of $0.1 billion.
For additional information related to discontinued operations,
see Note 2.
Geographic Operations
Our global activities span all geographic regions and primarily
encompass manufacturing for local and export markets, import
and sale of products produced in other regions, leasing of aircraft,
sourcing for our plants domiciled in other global regions and
provision of fi nancial services within these regional economies.
Thus, when countries or regions experience currency and/or
economic stress, we often have increased exposure to certain
risks, but also often have new profi t opportunities. New profi t
opportunities include, among other things, more opportunities
for expansion of industrial and fi nancial services activities
through purchases of companies or assets at reduced prices and
lower U.S. debt fi nancing costs.
Revenues are classifi ed according to the region to which prod-
ucts and services are sold. For purposes of this analysis, the U.S.
is presented separately from the remainder of the Americas. We
classify certain operations that cannot meaningfully be associated
with specifi c geographic areas as “Other Global” for this purpose.
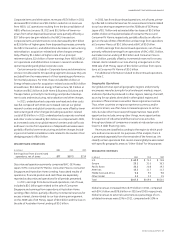
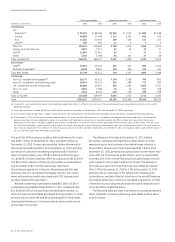
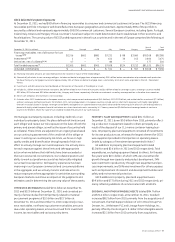
GEOGRAPHIC REVENUES
(In billions) 2011 2010 2009
U.S. $ 69.8 $ 75.1 $ 75.8
Europe 29.1 31.0 36.3
Pacific Basin 23.2 20.8 19.3
Americas 13.2 11.7 11.3
Middle East and Africa 9.8 9.0 9.8
Other Global 2.2 2.0 1.9
Total $147.3 $149.6 $154.4
Global revenues increased 4% to $77.5 billion in 2011, compared
with $74.5 billion and $78.6 billion in 2010 and 2009, respectively.
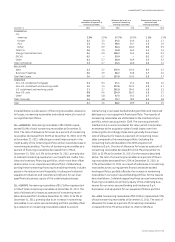
Global revenues to external customers as a percentage of con-
solidated revenues were 53% in 2011, compared with 50% in