GE 2011 Annual Report Download - page 100
Download and view the complete annual report
Please find page 100 of the 2011 GE annual report below. You can navigate through the pages in the report by either clicking on the pages listed below, or by using the keyword search tool below to find specific information within the annual report.-
 1
1 -
2
-
3
-
4
-
5
-
6
-
7
-
8
-
9
-
10
-
11
-
12
-
13
-
14
-
15
-
16
-
17
-
18
-
19
-
20
-
21
-
22
-
23
-
24
-
25
-
26
-
27
-
28
-
29
-
30
-
31
-
32
-
33
-
34
-
35
-
36
-
37
-
38
-
39
-
40
-
41
-
42
-
43
-
44
-
45
-
46
-
47
-
48
-
49
-
50
-
51
-
52
-
53
-
54
-
55
-
56
-
57
-
58
-
59
-
60
-
61
-
62
-
63
-
64
-
65
-
66
-
67
-
68
-
69
-
70
-
71
-
72
-
73
-
74
-
75
-
76
-
77
-
78
-
79
-
80
-
81
-
82
-
83
-
84
-
85
-
86
-
87
-
88
-
89
-
 90
90 -
 91
91 -
 92
92 -
 93
93 -
 94
94 -
 95
95 -
 96
96 -
 97
97 -
 98
98 -
 99
99 -
 100
100 -
 101
101 -
 102
102 -
 103
103 -
 104
104 -
 105
105 -
 106
106 -
 107
107 -
 108
108 -
 109
109 -
 110
110 -
111
-
112
-
113
-
114
-
115
-
116
-
117
-
118
-
119
-
120
-
121
-
122
-
123
-
124
-
125
-
126
-
127
-
128
-
129
-
130
-
131
-
132
-
133
-
134
-
135
-
136
-
137
-
138
-
139
-
140
-
141
-
142
-
143
-
144
-
145
-
146
 |
 |
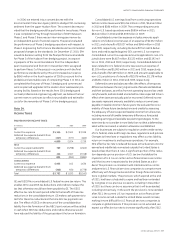
98 GE 2011 ANNUAL REPORT
in the forecasts of future cash fl ows, are refl ected in the selec-
tion of the discount rate. Equally important, under this approach,
reasonably likely scenarios and associated sensitivities can be
developed for alternative future states that may not be refl ected
in an observable market price. A market approach allows for
comparison to actual market transactions and multiples. It can
be somewhat more limited in its application because the popula-
tion of potential comparables is often limited to publicly-traded
companies where the characteristics of the comparative business
and ours can be signifi cantly different, market data is usually not
available for divisions within larger conglomerates or non-public
subsidiaries that could otherwise qualify as comparable, and the
specifi c circumstances surrounding a market transaction (e.g.,
synergies between the parties, terms and conditions of the trans-
action, etc.) may be different or irrelevant with respect to our
business. It can also be diffi cult, under certain market conditions,
to identify orderly transactions between market participants in
similar businesses. We assess the valuation methodology based
upon the relevance and availability of the data at the time we per-
form the valuation and weight the methodologies appropriately.
We performed our annual impairment test of goodwill for all
of our reporting units in the third quarter using data as of July 1,
2011. The impairment test consists of two steps: in step one, the
carrying value of the reporting unit is compared with its fair value;
in step two, which is applied when the carrying value is more
than its fair value, the amount of goodwill impairment, if any, is
derived by deducting the fair value of the reporting unit’s assets
and liabilities from the fair value of its equity, and comparing that
amount with the carrying amount of goodwill. In performing the
valuations, we used cash fl ows that refl ected management’s
forecasts and discount rates that included risk adjustments con-
sistent with the current market conditions. Based on the results
of our step one testing, the fair values of each of the GE industrial
reporting units and the CLL, Consumer, Energy Financial Services
and GECAS reporting units exceeded their carrying values; there-
fore, the second step of the impairment test was not required to
be performed and no goodwill impairment was recognized.
Our Real Estate reporting unit had a goodwill balance of
$1,001 million at December 31, 2011. As of July 1, 2011, the carry-
ing amount exceeded the estimated fair value of our Real Estate
reporting unit by approximately $0.7 billion. The estimated fair
value of the Real Estate reporting unit is based on a number of
assumptions about future business performance and investment,
including loss estimates for the existing fi nance receivable and
investment portfolio, new debt origination volume and margins,
and stabilization of the real estate market allowing for sales of real
estate investments at normalized margins. Our assumed discount
rate was 11.25% and was derived by applying a capital asset pric-
ing model and corroborated using equity analyst research reports
and implied cost of equity based on forecasted price to earnings
per share multiples for similar companies. Given the volatility and
uncertainty in the current commercial real estate environment,
there is uncertainty about a number of assumptions upon which
the estimated fair value is based. Different loss estimates for the
existing portfolio, changes in the new debt origination volume
and margin assumptions, changes in the expected pace of the
commercial real estate market recovery, or changes in the equity
return expectation of market participants may result in changes
in the estimated fair value of the Real Estate reporting unit.
Based on the results of the step one testing, we performed the
second step of the impairment test described above as of July 1,
2011. Based on the results of the second step analysis for the Real
Estate reporting unit, the estimated implied fair value of goodwill
exceeded the carrying value of goodwill by approximately $3.9 bil-
lion. Accordingly, no goodwill impairment was required. In the
second step, unrealized losses in an entity’s assets have the effect of
increasing the estimated implied fair value of goodwill. The results
of the second step analysis were attributable to several factors.
The primary driver was the excess of the carrying value over the
estimated fair value of our Real Estate Equity Investments, which
approximated $4.1 billion at that time. Other drivers for the favor-
able outcome include the unrealized losses in the Real Estate fi nance
receivable portfolio and the fair value premium on the Real Estate
reporting unit allocated debt. The results of the second step analy-
sis are highly sensitive to these measurements, as well as the key
assumptions used in determining the estimated fair value of the Real
Estate reporting unit.
Estimating the fair value of reporting units requires the use of
estimates and signifi cant judgments that are based on a number
of factors including actual operating results. If current conditions
persist longer or deteriorate further than expected, it is reason-
ably possible that the judgments and estimates described above
could change in future periods.