GE 2011 Annual Report Download - page 37
Download and view the complete annual report
Please find page 37 of the 2011 GE annual report below. You can navigate through the pages in the report by either clicking on the pages listed below, or by using the keyword search tool below to find specific information within the annual report.-
 1
1 -
2
-
3
-
4
-
5
-
6
-
7
-
8
-
9
-
10
-
11
-
12
-
13
-
14
-
15
-
16
-
17
-
18
-
19
-
20
-
21
-
22
-
23
-
24
-
25
-
26
-
 27
27 -
 28
28 -
 29
29 -
 30
30 -
 31
31 -
 32
32 -
 33
33 -
 34
34 -
 35
35 -
 36
36 -
 37
37 -
 38
38 -
 39
39 -
 40
40 -
 41
41 -
 42
42 -
 43
43 -
 44
44 -
 45
45 -
 46
46 -
 47
47 -
48
-
49
-
50
-
51
-
52
-
53
-
54
-
55
-
56
-
57
-
58
-
59
-
60
-
61
-
62
-
63
-
64
-
65
-
66
-
67
-
68
-
69
-
70
-
71
-
72
-
73
-
74
-
75
-
76
-
77
-
78
-
79
-
80
-
81
-
82
-
83
-
84
-
85
-
86
-
87
-
88
-
89
-
90
-
91
-
92
-
93
-
94
-
95
-
96
-
97
-
98
-
99
-
100
-
101
-
102
-
103
-
104
-
105
-
106
-
107
-
108
-
109
-
110
-
111
-
112
-
113
-
114
-
115
-
116
-
117
-
118
-
119
-
120
-
121
-
122
-
123
-
124
-
125
-
126
-
127
-
128
-
129
-
130
-
131
-
132
-
133
-
134
-
135
-
136
-
137
-
138
-
139
-
140
-
141
-
142
-
143
-
144
-
145
-
146
 |
 |
’
GE 2011 ANNUAL REPORT 35
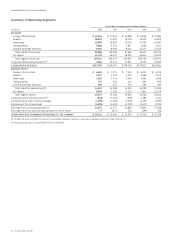
and 16%, respectively, in 2010. We continue to invest in market-
leading technologies and services at Aviation. Aviation revenues
and earnings increased in 2011 as a result of higher volume
and higher prices primarily driven by increased services and
equipment sales. In 2010, Aviation revenues decreased from a
reduction in volume refl ecting decreased commercial and mili-
tary equipment sales and services. Earnings decreased as a result
of lower productivity primarily due to product launch and produc-
tion costs associated with the GEnx engine shipments.
Healthcare (11% and 15% of consolidated three-year revenues
and total segment profi t, respectively) revenues and segment
profi t increased 7% and 2%, respectively, in 2011 and 6% and 13%,
respectively, in 2010. We continue to invest in market-leading
technologies and services at Healthcare. Healthcare revenues
increased over this period on increased volume from higher equip-
ment sales and services and the effects of the weaker U.S. dollar.
Healthcare earnings improved over this period on increased pro-
ductivity, higher volume and the effects of the weaker U.S. dollar.
Transportation (3% and 3% of consolidated three-year rev-
enues and total segment profi t, respectively) revenues and
segment profi t increased 45% and more than 100%, respectively,
in 2011 and fell 12% and 33%, respectively, in 2010. We con-
tinue to invest in market-leading technologies and services at
Transportation. Transportation revenues improved in 2011 due
to higher volume related to increased equipment sales and ser-
vices. Transportation earnings increased as a result of increased
productivity, refl ecting improved service margins and higher vol-
ume, while they declined in 2010 as the weakened economy had
driven overall reductions in U.S. freight traffi c and we updated our
estimates of long-term product service costs in our maintenance
service agreements.
Home & Business Solutions (6% and 2% of consolidated
three-year revenues and total segment profi t, respectively) rev-
enues have decreased 2% in 2011 and increased 2% in 2010.
Home & Business Solutions revenues trended down as a result
of lower volume in Appliances. The revenue increase in 2010 was
related to increased volume across all businesses. Segment profi t
decreased 34% in 2011 after increasing 24% in 2010 primarily as a
result of lower volume and the effects of infl ation.
GE Capital (31% and 21% of consolidated three-year revenues
and total segment profi t, respectively) net earnings increased
to $6.5 billion in 2011 and $3.2 billion in 2010 due to the contin-
ued stabilization in the overall economic environment. Over the
last several years, we tightened underwriting standards, shifted
teams from origination to collection and maintained a proactive
risk management focus. This, along with recent increased sta-
bility in the fi nancial markets, contributed to lower losses and a
signifi cant increase in segment profi t in 2011 and 2010. We also
reduced our ending net investment (ENI), excluding cash and
equivalents, from $526 billion at January 1, 2010 to $445 billion at
December 31, 2011. General Electric Capital Corporation (GECC)
is a diversely funded and smaller, more focused fi nance company
with strong positions in several commercial mid-market and con-
sumer fi nancing segments.
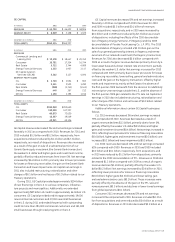
Overall, acquisitions contributed $4.6 billion, $0.3 billion and
$2.9 billion to consolidated revenues in 2011, 2010 and 2009,
respectively, excluding the effects of acquisition gains follow-
ing our adoption of an amendment to Financial Accounting
Standards Board (FASB) Accounting Standards Codifi cation (ASC)
810, Consolidation. Our consolidated net earnings included an
insignifi cant amount, $0.1 billion and $0.5 billion in 2011, 2010
and 2009, respectively, from acquired businesses. We integrate
acquisitions as quickly as possible. Only revenues and earnings
from the date we complete the acquisition through the end of
the fourth following quarter are attributed to such businesses.
Dispositions also affected our ongoing results through lower
revenues of $12.6 billion, $3.0 billion and $4.7 billion in 2011, 2010
and 2009, respectively. The effects of dispositions on net earnings
was a decrease of $0.3 billion in 2011 and increases of $0.1 billion
and $0.6 billion in 2010 and 2009, respectively.
DISCONTINUED OPERATIONS. Consistent with our goal of reducing
GECC ENI and focusing our businesses on selective fi nancial
services products where we have domain knowledge, broad
distribution, and the ability to earn a consistent return on capital,
while managing our overall balance sheet size and risk, in 2011,
we sold Consumer RV Marine, Consumer Mexico, Consumer
Singapore and Australian Home Lending. Discontinued operations
also includes BAC Credomatic GECF Inc. (BAC), our U.S. mortgage
business (WMC) and GE Money Japan (our Japanese personal loan
business, Lake, and our Japanese mortgage and card businesses,
excluding our investment in GE Nissen Credit Co., Ltd.). All of these
operations were previously reported in the GE Capital segment.
We reported the operations described above as discontin-
ued operations for all periods presented. For further information
about discontinued operations, see the “Segment Operations—
Discontinued Operations” section and Note 2.
WE DECLARED $7.5 BILLION IN DIVIDENDS IN 2011. Common per-
share dividends of $0.61 increased 33% from 2010, following a
25% decrease from the preceding year. In February 2009, we
announced the reduction of the quarterly GE stock dividend by
68% from $0.31 per share to $0.10 per share, effective with the
dividend approved by the Board in June 2009, which was paid in
the third quarter of 2009. In July 2010, our Board of Directors
approved a 20% increase in our regular quarterly dividend from
$0.10 per share to $0.12 per share and in December 2010,
approved an additional 17% increase from $0.12 per share to
$0.14 per share. On April 21, 2011, our Board of Directors
approved an increase in our regular quarterly dividend to $0.15
per share. On December 9, 2011, our Board of Directors approved
an increase in our regular quarterly dividend to $0.17 per share.
On February 10, 2012, our Board of Directors approved a regular
quarterly dividend of $0.17 per share of common stock, which is
payable April 25, 2012, to shareowners of record at close of busi-
ness on February 27, 2012. In 2011, 2010 and 2009, we declared
$1.0 billion (including $0.8 billion as a result of our redemption of
preferred stock), $0.3 billion and $0.3 billion in preferred stock
dividends, respectively. See Note 15 for additional information.