GE 2011 Annual Report Download - page 108
Download and view the complete annual report
Please find page 108 of the 2011 GE annual report below. You can navigate through the pages in the report by either clicking on the pages listed below, or by using the keyword search tool below to find specific information within the annual report.-
 1
1 -
2
-
3
-
4
-
5
-
6
-
7
-
8
-
9
-
10
-
11
-
12
-
13
-
14
-
15
-
16
-
17
-
18
-
19
-
20
-
21
-
22
-
23
-
24
-
25
-
26
-
27
-
28
-
29
-
30
-
31
-
32
-
33
-
34
-
35
-
36
-
37
-
38
-
39
-
40
-
41
-
42
-
43
-
44
-
45
-
46
-
47
-
48
-
49
-
50
-
51
-
52
-
53
-
54
-
55
-
56
-
57
-
58
-
59
-
60
-
61
-
62
-
63
-
64
-
65
-
66
-
67
-
68
-
69
-
70
-
71
-
72
-
73
-
74
-
75
-
76
-
77
-
78
-
79
-
80
-
81
-
82
-
83
-
84
-
85
-
86
-
87
-
88
-
89
-
90
-
91
-
92
-
93
-
94
-
95
-
96
-
97
-
 98
98 -
 99
99 -
 100
100 -
 101
101 -
 102
102 -
 103
103 -
 104
104 -
 105
105 -
 106
106 -
 107
107 -
 108
108 -
 109
109 -
 110
110 -
 111
111 -
 112
112 -
 113
113 -
 114
114 -
 115
115 -
 116
116 -
 117
117 -
 118
118 -
119
-
120
-
121
-
122
-
123
-
124
-
125
-
126
-
127
-
128
-
129
-
130
-
131
-
132
-
133
-
134
-
135
-
136
-
137
-
138
-
139
-
140
-
141
-
142
-
143
-
144
-
145
-
146
 |
 |

106 GE 2011 ANNUAL REPORT
Plan fi duciaries set investment policies and strategies for the trust
and oversee its investment allocation, which includes selecting
investment managers and setting long-term strategic targets.
The primary strategic investment objectives are balancing invest-
ment risk and return and monitoring the plan’s liquidity position in
order to meet the near term benefi t payment and other cash
needs. Target allocation percentages are established at an asset
class level by plan fi duciaries. Target allocation ranges are guide-
lines, not limitations, and occasionally plan fi duciaries will approve
allocations above or below a target range.
Trust assets invested in short-term securities must generally
be invested in securities rated A-1/P-1 or better, except for 15%
of such securities that may be rated A-2/P-2 and other short-term
securities as may be approved by the plan fi duciaries. According
to statute, the aggregate holdings of all qualifying employer
securities (e.g., GE common stock) and qualifying employer real
property may not exceed 10% of the fair value of trust assets at
the time of purchase. GE securities represented 4.7% and 4.5% of
trust assets at year-end 2011 and 2010, respectively.
Retiree life plan assets were $1,004 million and $1,125 mil-
lion at December 31, 2011 and 2010, respectively. Equity and
debt securities amounting to $760 million and $942 million
represented approximately 74% and 78% of total investments
at December 31, 2011 and 2010, respectively. The plans’ invest-
ments were classifi ed as 32% Level 1, 42% Level 2 and 26% Level
3 at December 31, 2011. The plans’ investments were classifi ed as
39% Level 1, 39% Level 2 and 22% Level 3 at December 31, 2010.
The changes in Level 3 investments were insignifi cant for the
years ended December 31, 2011 and 2010.
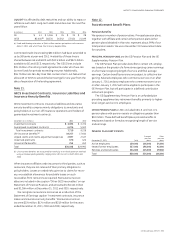
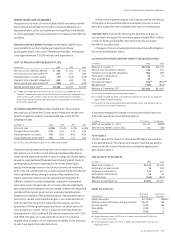
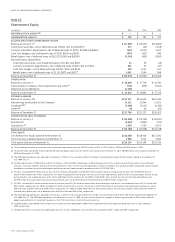
RETIREE BENEFIT ASSET (LIABILITY)
December 31 (In millions) 2011 2010
Funded status (a) $(12,052) $(10,885)
Liability recorded in the Statement
of Financial Position
Retiree health plans
Due within one year $ (602) $ (644)
Due after one year (9,684) (8,922)
Retiree life plans (1,766) (1,319)
Net liability recognized $(12,052) $(10,885)
Amounts recorded in shareowners’
equity (unamortized)
Prior service cost $ 2,901 $ 3,523
Net actuarial loss (gain) 401 (671)
Total $ 3,302 $ 2,852
(a) Fair value of assets less APBO, as shown in the preceding tables.
In 2012, we estimate that we will amortize $575 million of prior
service cost from shareowners’ equity into retiree benefi t plans
cost. Estimated 2012 retiree health plan gain amortization offsets
the expected amortization of retiree life plans losses. As such, the
amount of actuarial loss (gain) to be recycled from shareowners’
equity into retiree benefi t plans cost is expected to be insignifi -
cant. Comparable amortized amounts in 2011 were $647 million
of prior service cost and $110 million of net actuarial gains.
ESTIMATED FUTURE BENEFIT PAYMENTS
(a)
(In millions) 2012 2013 2014 2015 2016
2017–
2021
$800 $815 $830 $840 $840 $4,180
(a) Net of expected Medicare Part D subsidy of about $5 million annually.
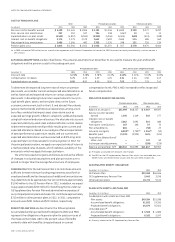
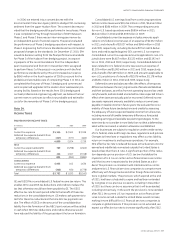
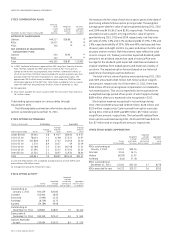
Postretirement Benefit Plans
2011 COST OF POSTRETIREMENT BENEFIT PLANS AND CHANGES IN
OTHER COMPREHENSIVE INCOME
Total
postretirement
(In millions) benefit plans
Principal
pension
plans
Other
pension
plans
Retiree
benefit
plans
Cost of postretirement
benefit plans $ 4,084 $ 2,446 $ 378 $1,260
Changes in other
comprehensive income
Net actuarial loss (gain)—
current year 13,293 10,655 1,676 962
Prior service cost (credit)—
current year 771 804 (58) 25
Prior service cost
amortization (854) (194) (13) (647)
Net actuarial gain (loss)
amortization (2,376) (2,335) (151) 110
Total changes in other
comprehensive income 10,834 8,930 1,454 450
Cost of postretirement
benefit plans and
changes in other
comprehensive income $14,918 $11,376 $1,832 $1,710
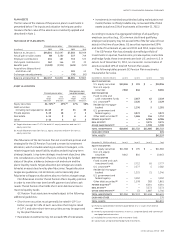
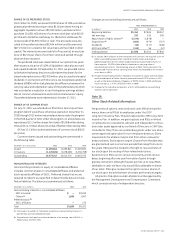
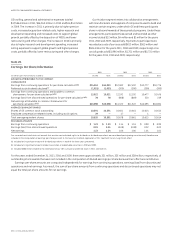
Note 13.
All Other Liabilities
This caption includes liabilities for various items including non-
current compensation and benefi ts, deferred income, interest on
tax liabilities, unrecognized tax benefi ts, environmental remedia-
tion, asset retirement obligations, derivative instruments, product
warranties and a variety of sundry items.
Accruals for non-current compensation and benefi ts amounted
to $39,430 million and $25,356 million at December 31, 2011 and
2010, respectively. These amounts include postretirement benefi ts,
pension accruals, and other compensation and benefi t accruals
such as deferred incentive compensation. See Note 12.
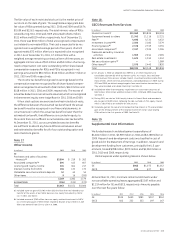
We are involved in numerous remediation actions to clean up
hazardous wastes as required by federal and state laws. Liabilities
for remediation costs exclude possible insurance recoveries and,
when dates and amounts of such costs are not known, are not
discounted. When there appears to be a range of possible costs
with equal likelihood, liabilities are based on the low end of such
range. It is reasonably possible that our environmental remedia-
tion exposure will exceed amounts accrued. However, due to
uncertainties about the status of laws, regulations, technology
and information related to individual sites, such amounts are not
reasonably estimable. Total reserves related to environmental
remediation, including asbestos claims, were $3,361 million at
December 31, 2011.