GE 2011 Annual Report Download - page 54
Download and view the complete annual report
Please find page 54 of the 2011 GE annual report below. You can navigate through the pages in the report by either clicking on the pages listed below, or by using the keyword search tool below to find specific information within the annual report.-
 1
1 -
2
-
3
-
4
-
5
-
6
-
7
-
8
-
9
-
10
-
11
-
12
-
13
-
14
-
15
-
16
-
17
-
18
-
19
-
20
-
21
-
22
-
23
-
24
-
25
-
26
-
27
-
28
-
29
-
30
-
31
-
32
-
33
-
34
-
35
-
36
-
37
-
38
-
39
-
40
-
41
-
42
-
43
-
 44
44 -
 45
45 -
 46
46 -
 47
47 -
 48
48 -
 49
49 -
 50
50 -
 51
51 -
 52
52 -
 53
53 -
 54
54 -
 55
55 -
 56
56 -
 57
57 -
 58
58 -
 59
59 -
 60
60 -
 61
61 -
 62
62 -
 63
63 -
 64
64 -
65
-
66
-
67
-
68
-
69
-
70
-
71
-
72
-
73
-
74
-
75
-
76
-
77
-
78
-
79
-
80
-
81
-
82
-
83
-
84
-
85
-
86
-
87
-
88
-
89
-
90
-
91
-
92
-
93
-
94
-
95
-
96
-
97
-
98
-
99
-
100
-
101
-
102
-
103
-
104
-
105
-
106
-
107
-
108
-
109
-
110
-
111
-
112
-
113
-
114
-
115
-
116
-
117
-
118
-
119
-
120
-
121
-
122
-
123
-
124
-
125
-
126
-
127
-
128
-
129
-
130
-
131
-
132
-
133
-
134
-
135
-
136
-
137
-
138
-
139
-
140
-
141
-
142
-
143
-
144
-
145
-
146
 |
 |

’
52 GE 2011 ANNUAL REPORT
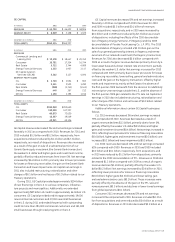
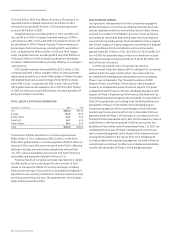
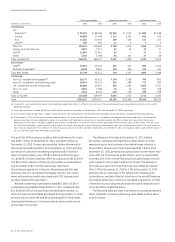
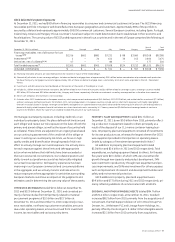
Financing receivables Nonearning receivables Allowance for losses
December 31 (In millions) 2011 2010 2011 2010 2011 2010
COMMERCIAL
CLL
Americas (a) $ 80,505 $ 88,558 $1,862 $ 2,573 $ 889 $1,288
Europe 36,899 37,498 1,167 1,241 400 429
Asia 11,635 11,943 269 406 157 222
Other (a) 436 664 11 646
Total CLL 129,475 138,663 3,309 4,226 1,450 1,945
Energy Financial Services 5,912 7,011 22 62 26 22
GECAS 11,901 12,615 55 —17 20
Other 1,282 1,788 65 102 37 58
Total Commercial 148,570 160,077 3,451 4,390 1,530 2,045
REAL ESTATE
Debt (b) 24,501 30,249 541 961 949 1,292
Business Properties (c) 8,248 9,962 249 386 140 196
Total Real Estate 32,749 40,211 790 1,347 1,089 1,488
CONSUMER
Non-U.S. residential mortgages (d) 36,170 40,011 3,349 3,738 706 803
Non-U.S. installment and revolving credit 18,544 20,132 263 289 717 937
U.S. installment and revolving credit 46,689 43,974 990 1,201 2,008 2,333
Non-U.S. auto 5,691 7,558 43 46 101 168
Other 7,244 8,304 419 478 199 259
Total Consumer 114,338 119,979 5,064 5,752 3,731 4,500
Total $295,657 $320,267 $9,305 $11,489 $6,350 $8,033
(a) During 2011, we transferred our Railcar lending and leasing portfolio from CLL Other to CLL Americas. Prior-period amounts were reclassified to conform to the current-
period presentation.
(b) Financing receivables included $0.1 billion and $0.2 billion of construction loans at December 31, 2011 and December 31, 2010, respectively.
(c) Our Business Properties portfolio is underwritten primarily by the credit quality of the borrower and secured by tenant and owner-occupied commercial properties.
(d) At December 31, 2011, net of credit insurance, approximately 25% of our secured Consumer non-U.S. residential mortgage portfolio comprised loans with introductory,
below market rates that are scheduled to adjust at future dates; with high loan-to-value ratios at inception (greater than 90%); whose terms permitted interest-only
payments; or whose terms resulted in negative amortization. At origination, we underwrite loans with an adjustable rate to the reset value. Of these loans, 79% are in our
U.K. and France portfolios, which comprise mainly loans with interest-only payments and introductory below market rates, have a delinquency rate of 15%, have a loan-to-
value ratio at origination of 76% and have re-indexed loan-to-value ratios of 84% and 56%, respectively. At December 31, 2011, 6% (based on dollar values) of these loans in
our U.K. and France portfolios have been restructured.
The portfolio of fi nancing receivables, before allowance for losses,
was $295.7 billion at December 31, 2011, and $320.3 billion at
December 31, 2010. Financing receivables, before allowance for
losses, decreased $24.6 billion from December 31, 2010, primarily
as a result of collections exceeding originations ($14.9 billion)
(which includes sales), write-offs ($7.2 billion) and the stronger
U.S. dollar ($1.5 billion), partially offset by acquisitions ($3.6 billion).
The $24.6 billion decline in fi nancing receivables excludes fi nanc-
ing receivables of $11.5 billion, previously reported in
Discontinued operations or Assets of businesses held for sale
(primarily non-U.S. residential mortgages and non-U.S. install-
ment and revolving credit) associated with 2011 business and
portfolio dispositions. See Note 2.
Related nonearning receivables totaled $9.3 billion (3.1% of
outstanding receivables) at December 31, 2011, compared with
$11.5 billion (3.6% of outstanding receivables) at December 31,
2010. Nonearning receivables decreased from December 31, 2010,
primarily due to write-offs and discounted payoffs in Real Estate,
improved performance in Commercial and improvements in our
entry rates in Consumer.
The allowance for losses at December 31, 2011 totaled
$6.4 billion compared with $8.0 billion at December 31, 2010,
representing our best estimate of probable losses inherent in
the portfolio. Allowance for losses decreased $1.7 billion from
December 31, 2010, primarily because provisions were lower than
write-offs, net of recoveries by $1.5 billion, which is attributable
to a reduction in the overall fi nancing receivables balance and an
improvement in the overall credit environment. The allowance
for losses as a percent of total fi nancing receivables decreased
from 2.5% at December 31, 2010 to 2.1% at December 31, 2011
primarily due to a decrease in the allowance for losses as dis-
cussed above, partially offset by a decline in the overall fi nancing
receivables balance as collections exceeded originations. Further
information surrounding the allowance for losses related to each
of our portfolios is detailed below.
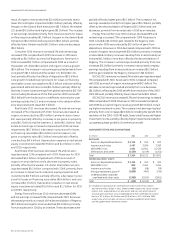
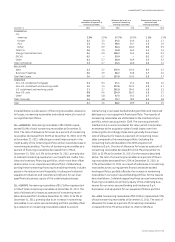
The following table provides information surrounding selected
ratios related to nonearning fi nancing receivables and the allow-
ance for losses.