GE 2011 Annual Report Download - page 101
Download and view the complete annual report
Please find page 101 of the 2011 GE annual report below. You can navigate through the pages in the report by either clicking on the pages listed below, or by using the keyword search tool below to find specific information within the annual report.-
 1
1 -
2
-
3
-
4
-
5
-
6
-
7
-
8
-
9
-
10
-
11
-
12
-
13
-
14
-
15
-
16
-
17
-
18
-
19
-
20
-
21
-
22
-
23
-
24
-
25
-
26
-
27
-
28
-
29
-
30
-
31
-
32
-
33
-
34
-
35
-
36
-
37
-
38
-
39
-
40
-
41
-
42
-
43
-
44
-
45
-
46
-
47
-
48
-
49
-
50
-
51
-
52
-
53
-
54
-
55
-
56
-
57
-
58
-
59
-
60
-
61
-
62
-
63
-
64
-
65
-
66
-
67
-
68
-
69
-
70
-
71
-
72
-
73
-
74
-
75
-
76
-
77
-
78
-
79
-
80
-
81
-
82
-
83
-
84
-
85
-
86
-
87
-
88
-
89
-
90
-
 91
91 -
 92
92 -
 93
93 -
 94
94 -
 95
95 -
 96
96 -
 97
97 -
 98
98 -
 99
99 -
 100
100 -
 101
101 -
 102
102 -
 103
103 -
 104
104 -
 105
105 -
 106
106 -
 107
107 -
 108
108 -
 109
109 -
 110
110 -
 111
111 -
112
-
113
-
114
-
115
-
116
-
117
-
118
-
119
-
120
-
121
-
122
-
123
-
124
-
125
-
126
-
127
-
128
-
129
-
130
-
131
-
132
-
133
-
134
-
135
-
136
-
137
-
138
-
139
-
140
-
141
-
142
-
143
-
144
-
145
-
146
 |
 |
GE 2011 ANNUAL REPORT 99
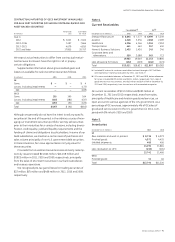
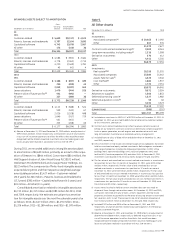
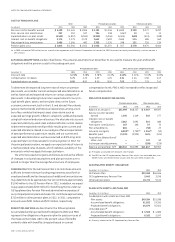
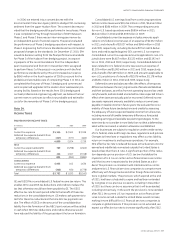
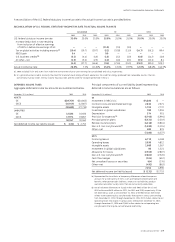
INTANGIBLE ASSETS SUBJECT TO AMORTIZATION
December 31 (In millions)
Gross
carrying
amount
Accumulated
amortization Net
GE
2011
Customer-related $ 5,638 $(1,117) $ 4,521
Patents, licenses and trademarks 5,797 (2,104) 3,693
Capitalized software 4,743 (2,676) 2,067
All other 176 (140) 36
Total $16,354 $(6,037) $10,317
2010
Customer-related $ 4,386 $ (902) $ 3,484
Patents, licenses and trademarks 4,778 (2,063) 2,715
Capitalized software 4,230 (2,449) 1,781
All other 45 (41) 4
Total $13,439 $(5,455) $ 7,984
GECS
2011
Customer-related $ 1,186 $ (697) $ 489
Patents, licenses and trademarks 250 (208) 42
Capitalized software 2,048 (1,597) 451
Lease valuations 1,470 (944) 526
Present value of future profits (a) 491 (491) —
All other 327 (289) 38
Total $ 5,772 $(4,226) $ 1,546
2010
Customer-related $ 1,112 $ (588) $ 524
Patents, licenses and trademarks 599 (532) 67
Capitalized software 2,026 (1,528) 498
Lease valuations 1,646 (917) 729
Present value of future profits (a) 461 (461) —
All other 333 (268) 65
Total $ 6,177 $(4,294) $ 1,883
(a) Balance at December 31, 2011 and December 31, 2010 reflects an adjustment of
$391 million and $423 million, respectively, to the present value of future profits
in our run-off insurance operations to reflect the effects that would have been
recognized had the related unrealized investment securities holding gains and
losses actually been realized in accordance with ASC 320-10-S99-2.
During 2011, we recorded additions to intangible assets subject
to amortization of $3,609 million, primarily as a result of the acqui-
sition of Dresser, Inc. ($844 million), Converteam ($814 million), the
Well Support division of John Wood Group PLC ($571 million),
Wellstream PLC ($258 million) and Lineage Power Holdings, Inc.
($122 million). The components of fi nite-lived intangible assets
acquired during 2011 and their respective weighted-average
amortizable period are: $1,427 million—Customer-related
(20.0 years); $1,366 million—Patents, licenses and trademarks
(17.2 years); $785 million—Capitalized software (4.0 years); and
$31 million—All other (11.4 years).
Consolidated amortization related to intangible assets was
$1,732 million, $1,747 million and $2,083 million for 2011, 2010
and 2009, respectively. We estimate annual pre-tax amortiza-
tion for intangible assets over the next fi ve calendar years to be
as follows: 2012—$1,647 million; 2013—$1,491 million; 2014—
$1,326 million; 2015—$1,189 million; and 2016—$1,070 million.
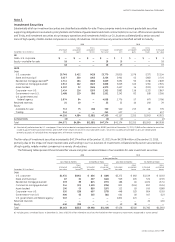
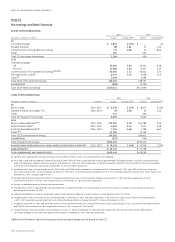
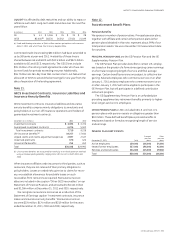
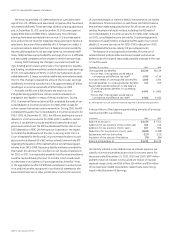
Note 9.
All Other Assets
December 31 (In millions) 2011 2010
GE
Investments
Associated companies (a) $ 20,463 $ 2,092
Other 607 535
21,070 2,627
Contract costs and estimated earnings (b) 9,008 8,061
Long-term receivables, including notes (c) 1,316 1,098
Derivative instruments 370 412
Other 4,911 5,256
36,675 17,454
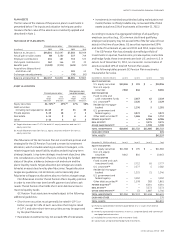
GECS
Investments
Real estate (d)(e) 28,255 31,555
Associated companies 23,589 25,662
Assets held for sale (f) 4,525 3,540
Cost method (e) 1,882 1,937
Other 1,722 2,251
59,973 64,945
Derivative instruments 9,671 5,034
Advances to suppliers 1,560 1,853
Deferred borrowing costs (g) 1,327 1,982
Deferred acquisition costs (h) 55 60
Other 3,032 3,323
75,618 77,197
ELIMINATIONS (586) (352)
Total $111,707 $94,299
(a) Included our investment in NBCU LLC of $17,955 million at December 31, 2011. At
December 31, 2011, we also had $4,880 million of deferred tax liabilities related
to this investment. See Note 14.
(b) Contract costs and estimated earnings reflect revenues earned in excess of
billings on our long-term contracts to construct technically complex equipment
(such as power generation, aircraft engines and aeroderivative units) and
long-term product maintenance or extended warranty arrangements.
(c) Included loans to GECS of $388 million and $856 million at December 31, 2011
and 2010, respectively.
(d) GECS investments in real estate consisted principally of two categories: real estate
held for investment and equity method investments. Both categories contained a
wide range of properties including the following at December 31, 2011: office
buildings (46%), apartment buildings (14%), industrial properties (10%), retail
facilities (8%), franchise properties (8%) and other (14%). At December 31, 2011,
investments were located in the Americas (48%), Europe (27%) and Asia (25%).
(e) The fair value of and unrealized loss on cost method investments in a continuous
loss position for less than 12 months at December 31, 2011, were $425 million
and $61 million, respectively. The fair value of and unrealized loss on cost
method investments in a continuous loss position for 12 months or more at
December 31, 2011, were $65 million and $3 million, respectively. The fair value
of and unrealized loss on cost method investments in a continuous loss position
for less than 12 months at December 31, 2010, were $396 million and $55 million,
respectively. The fair value of and unrealized loss on cost method investments in
a continuous loss position for 12 months or more at December 31, 2010, were
$16 million and $2 million, respectively.
(f) Assets were classified as held for sale on the date a decision was made to
dispose of them through sale or other means. At December 31, 2011 and 2010,
such assets consisted primarily of loans, aircraft, equipment and real estate
properties, and were accounted for at the lower of carrying amount or estimated
fair value less costs to sell. These amounts are net of valuation allowances of
$122 million and $115 million at December 31, 2011 and 2010, respectively.
(g) Included $329 million and $916 million at December 31, 2011 and 2010,
respectively, of unamortized fees related to our participation in the Temporary
Liquidity Guarantee Program.
(h) Balance at December 31, 2011 and December 31, 2010 reflects an adjustment of
$810 million and $860 million, respectively, to deferred acquisition costs in our
run-off insurance operations to reflect the effects that would have been
recognized had the related unrealized investment securities holding gains and
losses actually been realized in accordance with ASC 320-10-S99-2.