Energizer 2006 Annual Report Download - page 44
Download and view the complete annual report
Please find page 44 of the 2006 Energizer annual report below. You can navigate through the pages in the report by either clicking on the pages listed below, or by using the keyword search tool below to find specific information within the annual report.-
 1
1 -
2
-
3
-
4
-
5
-
6
-
7
-
8
-
9
-
10
-
11
-
12
-
13
-
14
-
15
-
16
-
17
-
18
-
19
-
20
-
21
-
22
-
23
-
24
-
25
-
26
-
27
-
28
-
29
-
30
-
31
-
32
-
33
-
 34
34 -
 35
35 -
 36
36 -
 37
37 -
 38
38 -
 39
39 -
 40
40 -
 41
41 -
 42
42 -
 43
43 -
 44
44 -
 45
45 -
 46
46 -
 47
47
 |
 |

ENERGIZER HOLDINGS, INC.
Notes to Consolidated Financial Statements
(Dollars in millions, except per share and percentage data)
42 ENR 2006 ANNUAL REPORT
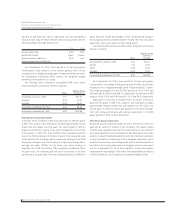
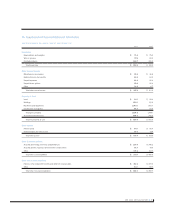
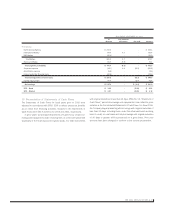
Geographic segment information on a legal entity basis:
2006 2005 2004
Net Sales to Customers
United States $1,474.5 $ 1,409.2 $ 1,338.1
International 1,602.4 1,580.6 1,474.6
Total net sales $3,076.9 $ 2,989.8 $ 2,812.7
Long-Lived Assets
United States $ 502.4 $ 516.8
Germany 126.5 120.8
Other International 197.4 208.2
Total long-lived assets $ 826.3 $ 845.8
The Company’s international net sales are derived from customers
in numerous countries, with sales to customers in Japan representing
5.0%, 5.7% and 5.8% of the Company’s total sales in 2006, 2005
and 2004, respectively. Sales to customers in all other single foreign
countries represented less than 5% of the Company’s total sales for
each of the three years ended September 30.
Supplemental product information is presented below for net sales:
2006 2005 2004
Net Sales
Alkaline batteries $ 1,338.0 $ 1,330.0 $ 1,284.0
Carbon zinc batteries 242.2 254.0 247.9
Other batteries and lighting products 566.9 475.0 412.7
Razors and Blades 929.8 930.8 868.1
Total net sales $ 3,076.9 $ 2,989.8 $ 2,812.7
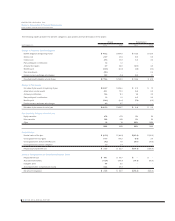
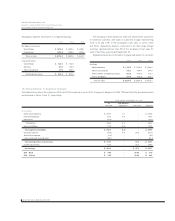
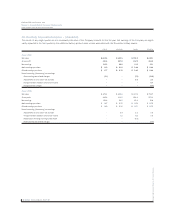
18. Reconciliation of Segment Changes
The tables below reflect the impact on 2005 and 2004 results as a result of the Company’s adoption of SFAS 123R and the fully allocated method
as described in Notes 7 and 17, respectively.
YEAR ENDED SEPTEMBER 30, 2005
As Fully Allocated
Reported Adjustment FAS 123R Adjusted
Profitability
North America Battery $ 295.7 0.1 – $ 295.8
International Battery 173.7 4.8 – 178.5
R&D Battery (36.0) – – (36.0)
Total Battery 433.4 4.9 – 438.3
Razors and Blades 117.3 (9. 8) – 107.5
Total segment profitability $ 550.7 (4.9) –$ 545.8
Corporate expense (97.6) 4.9 (9.0) (101.7)
Amortization expense (5.3) – – (5.3)
Interest and other financial items (50.1) – – (50.1)
Total earnings before income taxes $ 397.7 –(9.0) $ 388.7
Income tax provision 111.3 – ( 3.3) 108.0
Net earnings $ 286.4 –$ (5.7) $ 280.7
EPS –Basic $ 4.03 –(0.08) $ 3.95
EPS –Diluted $ 3.90 –(0.08) $ 3.82