Energizer 2006 Annual Report Download - page 4
Download and view the complete annual report
Please find page 4 of the 2006 Energizer annual report below. You can navigate through the pages in the report by either clicking on the pages listed below, or by using the keyword search tool below to find specific information within the annual report.-
 1
1 -
 2
2 -
 3
3 -
 4
4 -
 5
5 -
 6
6 -
 7
7 -
 8
8 -
 9
9 -
 10
10 -
 11
11 -
 12
12 -
 13
13 -
 14
14 -
 15
15 -
16
-
17
-
18
-
19
-
20
-
21
-
22
-
23
-
24
-
25
-
26
-
27
-
28
-
29
-
30
-
31
-
32
-
33
-
34
-
35
-
36
-
37
-
38
-
39
-
40
-
41
-
42
-
43
-
44
-
45
-
46
-
47
 |
 |

As an organization, we remain focused on delivering consistent and
superior financial performance. Concentrating specifically on innovation
and cost control across just two consumer product categories gives
us a distinct advantage as we face large, worldwide conglomerates in
the global marketplace. We are passionate and flexible in striving to meet
the needs of our consumers and retail customers.
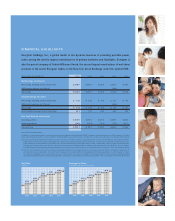
Financial Performance
For the fiscal year ended September 30, 2006 – our sixth full year as a
stand-alone company – Energizer’s net earnings were $260.9 million,
and earnings per share increased 8 percent to $4.14
compared to $3.82 the year before. Net sales for the
year grew to a record $3.1 billion.
Earnings per share growth remains strong and
consistent, driven primarily by the profit generated by
our operating businesses, as well as our active share
repurchase program. Accordingly, executive manage-
ment is incented to deliver a minimum of 10 percent
annual growth in earnings per share and subject to
financial penalties if earnings decline. For the last five
years, our earnings per share has grown at a
compounded annual growth rate of 21 percent, one of
the best growth rates in the U.S. household products
group. And since our spin-off in 2000, our share price
has been highly correlated with earnings per share with
shares appreciating over 200 percent.
We remain intently focused on generating cash flow
as the engine to grow our business, strengthen our balance sheet and
reward long-term shareholders. In fiscal 2006, we generated $278 million
of free cash flow, increasing our total since our spin-off to $1.67 billion.
Our foremost priority for the use of cash flow is to fund innovation in
our current businesses. Our second priority for the use of cash flow is
acquisitions, and we continue to actively seek opportunities that would
complement our existing consumer products businesses. Finally, we
focus on share repurchase and debt repayment for the use of cash flow.
Share Repurchase
During fiscal 2006, the company repurchased 11.3 million shares of
its common stock for $600.7 million. Since our spin-off in April 2000,
we have repurchased 47 percent of the original shares outstanding –
a total of 45.4 million shares for $1.9 billion at an average price of $42.29,
well below the $71.99 share price at fiscal year-end. In July 2006, the
company’s Board of Directors approved a new authorization for the com-
pany to acquire up to 10 million additional shares of its common stock.
As of September 30, 8.8 million of the authorization remains available.
We view share repurchase as a means to generate investment returns
for our shareholders. We opportunistically repurchase shares in instances
where we believe our equity is undervalued relative to our future
prospects. To date, share repurchases have been a great investment, as
we have consistently surpassed market expectations.
Challenging Business Climate
In seeking to sustain our solid financial performance and
steady stock price appreciation, we confront various
challenges in the marketplace.
Raw materials. Substantial increases in the cost of raw
materials such as zinc, a key ingredient in batteries,
necessitated our first across-the-board price increase
in years. We use roughly 75 million pounds of zinc a
year, so a 1 cent cost increase has a negative impact of
$750,000 annually – and the price of zinc escalated
from 64 cents a pound at the end of fiscal 2005 to over
$2.00 a pound in November 2006, making the cost
challenge significant. The 6.7 percent price increase
previously implemented in U.S. and other markets,
combined with a number of additional price increases
including the recently announced adjustment effective
January 2007 for the United States, will help to offset
a portion of the rising zinc costs.
Foreign currencies. With half our sales outside the United States, we
face the risk of weaker foreign currencies. For example, a 10 percent
weakening of the euro or yen translates into a negative impact on
Energizer of approximately $10 million on an annualized basis.
Competition. Energizer faces a formidable consumer package goods
competitor many times our size. Though small by today’s standards, we
boast a substantial presence in those categories where we choose to
compete. Certainly size matters, but we believe scale in the categories
where we participate is most important – and Energizer claims a
substantial share in the categories we operate in. Focusing our energies
and leveraging our expertise in two primary business categories allows us
to effectively compete in the marketplace.
INSIGHT:
Net sales for the
company grew
to a record
$3.1
BILLION
in fiscal 2006.
2 ENR 2006 ANNUAL REPORT
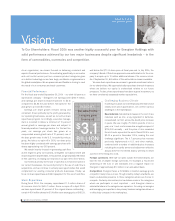
Vision:
To Our Shareholders: Fiscal 2006 was another highly successful year for Energizer Holdings with
solid performance achieved by our two major businesses despite significant headwinds – in the
form of commodities, currencies and competition.
WARD M. KLEIN
Chief Executive Officer