Energizer 2006 Annual Report Download - page 12
Download and view the complete annual report
Please find page 12 of the 2006 Energizer annual report below. You can navigate through the pages in the report by either clicking on the pages listed below, or by using the keyword search tool below to find specific information within the annual report.-
 1
1 -
 2
2 -
 3
3 -
 4
4 -
 5
5 -
 6
6 -
 7
7 -
 8
8 -
 9
9 -
 10
10 -
 11
11 -
 12
12 -
 13
13 -
 14
14 -
 15
15 -
 16
16 -
 17
17 -
 18
18 -
 19
19 -
 20
20 -
 21
21 -
 22
22 -
23
-
24
-
25
-
26
-
27
-
28
-
29
-
30
-
31
-
32
-
33
-
34
-
35
-
36
-
37
-
38
-
39
-
40
-
41
-
42
-
43
-
44
-
45
-
46
-
47
 |
 |

ENERGIZER HOLDINGS, INC.
Management’s Discussion and Analysis of Results of Operations and Financial Condition
(Dollars in millions, except per share and percentage data)
10 ENR 2006 ANNUAL REPORT
The following discussion is a summary of the key factors management
considers necessary in reviewing Energizer Holdings, Inc.’s (the
Company) historical basis results of operations, operating segment
results, and liquidity and capital resources. The Company includes the
battery business (Energizer) and the razors and blades business
(Schick-Wilkinson Sword, or SWS). This discussion should be read
in conjunction with the Consolidated Financial Statements and
related notes.
Battery Business Overview
Energizer is one of the world’s largest manufacturers and marketers of
batteries and flashlights competing in the retail battery category.
We define the retail battery category as household batteries (alkaline,
carbon zinc, lithium and rechargeable) and specialty batteries
(miniature and photo). We market a complete line of household batteries
with two primary brands, Energizer and Eveready, which are well known
throughout the world.
Alkaline batteries are the predominant household battery chemistry
in developed parts of the world, while carbon zinc batteries continue to
play a major role in less developed countries throughout the world.
Recently, higher power, higher priced lithium and rechargeable batteries
have grown significantly in response to more demanding power needs
of newer devices such as digital cameras. We use our full portfolio of
products and brands to meet consumer and retail customer needs and
to maintain and enhance our position across the varied markets of the
world. Our presence outside the United States (U.S.) runs from highly
developed economic markets to emerging markets with lower per capita
income. Our portfolio of products allows us to compete in low price
markets and take advantage of trading consumers up to higher
performing products as the macroeconomic trends improve.
Energizer operates 19 manufacturing and packaging facilities in
12 countries on four continents. Its products are marketed and sold in
more than 165 countries, primarily through a direct sales force, and also
through distributors and wholesalers.
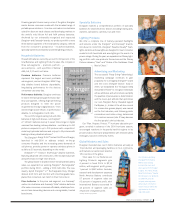
The battery category continues to be highly competitive as brands
compete for consumer acceptance and retail shelf space. Overall
battery consumption has been increasing for many years, but category
value growth in the U.S. lagged unit sales until 2006 as consumer
purchases have shifted to larger package sizes, which sell at lower per
unit prices. Retail outlets experiencing the strongest battery category
growth in the U.S. are those which feature larger package sizes.
In 2006, higher material costs have triggered price increases in the
U.S. by all major battery manufacturers.
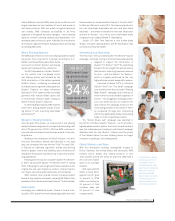
Energizer is well positioned to meet the needs of customer and
consumer demands, leveraging category expertise, retail understanding
and its portfolio of products to give Energizer a strong presence across
the retail channels. Energizer estimates its share of the total U.S. retail
battery category was approximately 37% in 2006, 36% in 2005 and
34% in 2004.
Internationally, a difficult competitive environment in Europe and
currency valuations relative to the U.S. dollar, particularly the euro,
weakened in 2006 resulting in lower International Battery segment
results. A significant portion of Energizer’s product cost is more closely
tied to the U.S. dollar than to the local currencies in which the product
is sold. As such, currencies strengthening relative to the U.S. dollar
improve margins as product costs in local currency terms decline.
Conversely, weakening currencies relative to the U.S. dollar can be
significantly unfavorable unless mitigated through pricing actions.
Changes in the value of local currencies will continue to impact
segment profitability in the future. At mid-November 2006 levels, over-
all currency translation is modestly favorable to average 2006 rates.
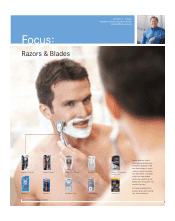
Razors and Blades Business Overview
In 2003, the Company acquired the worldwide SWS business from
Pfizer, Inc. SWS is the second largest manufacturer and marketer of
men’s and women’s wet shave products in the world. SWS operates
four manufacturing facilities worldwide and its products are marketed
in more than 125 countries. Its primary markets are the U.S., Canada,
Japan and the larger countries of Western Europe. SWS estimates its
overall share of the wet shave category for these major markets at
approximately 21% in 2006 and 2005 and 22% in 2004.
The global wet shave products category is dominated by a limited
number of manufacturers. Category blade unit consumption has been
relatively flat for a number of years, and product innovations and
corresponding increased per unit prices have accounted for category
growth, particularly in the last several years. The category is extremely
competitive for consumer loyalty and retail shelf space.
A significant portion of product cost is closely tied to the U.S. dollar
and the euro. As such, SWS results are highly sensitive to fluctuations
in other currencies in which much of its products are sold, particularly
the Japanese yen. Strengthening of currencies compared to the U.S.
dollar, and to a lesser extent to the euro, improves margins while
declines in such currency values reduce margins. At mid-November
2006 levels, currency translation is slightly unfavorable to SWS
compared to average 2006 rates.
Highlights
Net earnings for the year ended September 30, 2006 were $260.9
compared to $280.7 in 2005 and $261.0 in 2004. Basic and diluted
earnings
per share in 2006 were $4.26 and $4.14, respectively, compared
to $3.95 and $3.82 in 2005 and $3.24 and $3.13 in 2004.
Current year net earnings include the following items, stated on an
after-tax basis:
charges of $24.9, or $0.39 per diluted share, related to European restructuring
programs,
a charge of $3.7, or $0.06 per diluted share, to record the cumulative amount
of foreign pension costs that should have been previously recognized and
favorable adjustments to prior years’ tax accruals and previously unrecognized
tax benefits related to foreign losses of $16.6, or $0.26 per diluted share.
Fiscal 2005 net earnings included the following, stated on an after-
tax basis:
tax benefits totaling $25.3, or $0.34 per diluted share, related to tax loss
benefits and adjustments to prior year tax accruals, partially offset by,