Energizer 2006 Annual Report Download - page 16
Download and view the complete annual report
Please find page 16 of the 2006 Energizer annual report below. You can navigate through the pages in the report by either clicking on the pages listed below, or by using the keyword search tool below to find specific information within the annual report.
ENERGIZER HOLDINGS, INC.
Management’s Discussion and Analysis of Results of Operations and Financial Condition
(Dollars in millions, except per share and percentage data)
14 ENR 2006 ANNUAL REPORT
Income Taxes
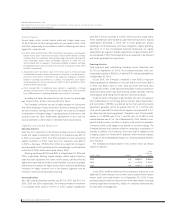
Income taxes, which include federal, state and foreign taxes, were
26.8%, 27.8% and 25.0% of earnings before income taxes in 2006, 2005
and 2004, respectively. Income taxes include the following items which
impact the overall tax rate:
In 2006, 2005 and 2004, $5.7, $14.7 and $16.2, respectively, of tax benefits
related to prior years’ losses were recorded. These benefits related to foreign
countries where our subsidiary subsequently began to generate earnings and
could reasonably expect future profitability sufficient to utilize tax loss
carry-forwards prior to expiration. Improved profitability in Mexico, Germany
and Switzerland account for the bulk of the amount recognized in 2006, 2005
and 2004, respectively.
Adjustments were recorded in each of the three years to revise previously
recorded tax accruals to reflect refinement of estimates of tax attributes to
amounts in filed returns, settlement of tax audits and changes in estimates
related to uncertain tax positions in a number of jurisdictions. Such adjust-
ments decreased the income tax provision by $10.9, $10.6 and $8.5 in 2006,
2005 and 2004, respectively.
2005 included $9.0 of additional taxes related to repatriation of foreign
earnings under provisions of the American Jobs Creation Act, which provided
for an 85% exclusion of qualifying dividends from normal U.S. tax rates.
Excluding the items discussed above, the income tax percentage
was 31.5% in 2006, 32.0% in 2005 and 32.1% in 2004.
The Company’s effective tax rate is highly sensitive to country mix
from which earnings or losses are derived. Declines in earnings in lower
tax rate countries, earnings increase in higher tax countries, increases
in repatriation of foreign earnings or operating losses in the future could
increase future tax rates. Additionally, adjustments to prior year tax
accrual estimates could increase or decrease future tax provisions.
Liquidity and Capital Resources
Operating Activities
Cash flow from operations is the primary funding source for operating
needs and capital investments. Cash flow from operations was $373.0
in 2006, an increase of $77.1 from 2005, primarily on lower net working
capital investment in 2006. Cash flow from operations was $295.9
in 2005, a decrease of $183.4 from 2004 on a significant increase in
working capital in 2005, primarily due to unusually high current liabilities
at the end of 2004, which were repaid early in 2005.
Working capital was $708.2 and $626.4 at September 30, 2006 and
2005, respectively. Working capital changes reflect higher inventory,
cash and cash equivalents and other current assets, partially offset by
higher short-term debt and other current liabilities. Accounts receivable
and inventory increased on higher sales volume. Inventory additionally
increased on higher material cost in the battery segments and an
increase in intercontinental product sourcing.
Investing Activities
Net cash used by investing activities was $115.6, $97.1 and $111.3 in
2006, 2005 and 2004, respectively. The Company made an investment
in its prepaid share options of $19.6 in 2006. Capital expenditures
were $94.9, $103.0 and $121.4 in 2006, 2005 and 2004, respectively.
These expenditures were funded by cash flow from operations. Capital
expenditures decreased in 2005 due to lower production project
spending in both businesses and lower integration capital spending.
See Note 17 of the Consolidated Financial Statements for capital
expenditures by segment. Capital expenditures of approximately $105
are anticipated in 2007. Such expenditures are expected to be financed
with funds generated from operations.
Financing Activities
Total long-term debt outstanding, including current maturities, was
$1,710.0 at September 30, 2006. The Company maintains total com-
mitted debt facilities of $2,185.0, of which $475.0 remained available as
of September 30, 2006.
In July 2006, the Company completed a new $500.0 long-term
financing agreement. Maturities on the new debt are as follows: $80.0
in 2009 and $140.0 each in 2011, 2014 and 2016 with fixed rates
ranging from 5.99% to 6.24%. Approximately $420 of the proceeds from
these notes were used to pay down existing variable rate debt, with the
remaining proceeds being held for general corporate purposes.
Under the terms of Energizer’s debt facilities, the ratio of Energizer’s
total indebtedness to its Earnings Before Interest, Taxes, Depreciation
and Amortization (EBITDA) (as defined by the most restrictive facility
agreement) generally cannot be greater than 3.5 to 1, and the ratio
of its current year EBIT to total interest expense must exceed 3.0 to 1
(as defined by the facility agreement). Energizer’s ratio of total indebt-
edness to its EBITDA was 3.2 to 1, and the ratio of its EBIT to total
interest expense was 5.7 to 1 as of September 30, 2006. Failure to com-
ply with the above ratios or other covenants could result in acceleration
of maturity, which could trigger cross defaults on other borrowings. The
Company believes that covenant violations resulting in acceleration of
maturity is unlikely. The Company’s fixed rate debt is callable by the
Company, subject to a “make whole” premium, which would be required
to the extent the underlying benchmark U.S. treasury yield has declined
since issuance.
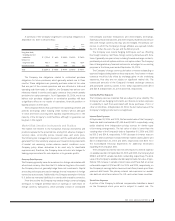
The Company purchased shares of its common stock as follows
(shares in millions):
TOTAL
AVERAGE
FISCAL YEAR SHARES COST PRICE
2006 11.3 $ 600.7 $ 53.02
2005 8.1 $ 457.4 $ 56.37
2004 13.4 $ 546.7 $ 40.94
In July 2006, the Board authorized the Company to acquire up to an
additional 10 million shares of its common stock, and 8.8 million shares
remain under such authorization as of September 30, 2006. Future
purchases may be made from time to time on the open market or through
privately negotiated transactions, subject to corporate objectives and
the discretion of management.


