Energizer 2006 Annual Report Download - page 14
Download and view the complete annual report
Please find page 14 of the 2006 Energizer annual report below. You can navigate through the pages in the report by either clicking on the pages listed below, or by using the keyword search tool below to find specific information within the annual report.-
 1
1 -
2
-
3
-
 4
4 -
 5
5 -
 6
6 -
 7
7 -
 8
8 -
 9
9 -
 10
10 -
 11
11 -
 12
12 -
 13
13 -
 14
14 -
 15
15 -
 16
16 -
 17
17 -
 18
18 -
 19
19 -
 20
20 -
 21
21 -
 22
22 -
 23
23 -
 24
24 -
25
-
26
-
27
-
28
-
29
-
30
-
31
-
32
-
33
-
34
-
35
-
36
-
37
-
38
-
39
-
40
-
41
-
42
-
43
-
44
-
45
-
46
-
47
 |
 |

ENERGIZER HOLDINGS, INC.
Management’s Discussion and Analysis of Results of Operations and Financial Condition
(Dollars in millions, except per share and percentage data)
12 ENR 2006 ANNUAL REPORT
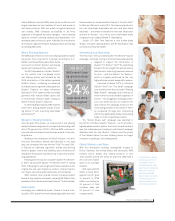
than 40%. Battery charger sales were up more than 50%, including
the launch of our new Energi To Go cell phone charger line. The price
portfolio, which includes carbon zinc and Eveready Gold alkaline batter-
ies, volume declined 2% in 2006. Overall pricing and product mix were
unfavorable $7.6 in 2006 as higher list prices, particularly in the latter
portion of the year, were more than offset by a continuing shift
to trade channels that feature larger package sizes with lower per
unit prices. Canadian currency translation favorably impacted sales by
$6.1 in 2006 compared to 2005.
Gross margin dollars increased $10.9 in 2006 as contribution from
higher sales was partially offset by $16.7 of unfavorable product costs.
Material and distribution costs were unfavorable $20, with zinc cost
increases accounting for the bulk of the total. Segment profit increased
$4.9, as higher gross margin was partially offset by higher A&P and
general and administrative expenses.
For the year ended September 30, 2005, sales increased $55.5,
or 5%, as incremental sales volume of $91.1 and favorable Canadian
currency translation of $7.3 was partially offset by unfavorable pricing
and product mix of $42.9. Fiscal 2005 sales included approximately
$21 of hurricane-related incremental sales compared to approximately
$40 in fiscal 2004. Energizer MAX volume for the year increased 8%, as
higher general demand was partially offset by lower hurricane-related
sales in 2005 compared to 2004. High performance rechargeable and
e2lithium product sales increased in excess of 20%. Overall pricing and
product mix were unfavorable in 2005 on the aforementioned mix shift,
and pricing declines in non-Energizer branded products.
Gross margin dollars declined $6.4 in 2005. The margin contribution
of higher sales volume and favorable currency translation of $6.6 were
substantially offset by unfavorable pricing and product mix. Product
cost was unfavorable $13.4 as higher commodity-based material costs
of approximately $17 were partially offset by other production cost savings.
Segment profit declined $2.4 as lower gross margin was partially offset
by lower general and administrative and A&P expenses.
Looking ahead, key commodity metal material costs are currently
above the already historically high costs of 2006. At current prices, zinc
costs for 2007 will be more than double the 2006 rates. If product sold
during 2006 had been produced at anticipated 2007 production costs,
the result would have been additional costs of $31 to $34. Previously
implemented price increases will improve the pricing early in fiscal
2007, but will be insufficient to cover the entire current cost increase
in the first fiscal quarter. Energizer has announced a price increase in
the U.S. as of January 2007, which is intended to cover the bulk of
the material cost increase. Per unit gross margin will continue to be
unfavorable until the January 2007 price increase takes effect.
INTERNATIONAL BATTERY
2006 2005 2004
Net sales $ 913.3 $ 885.9 $ 827.0
Segment profit $ 177.3 $ 178.5 $ 152.4
For the year ended September 30, 2006, net sales increased $27.4,
or 3%. Excluding currency impacts, International Battery sales increased
$38.3, or 4%, on higher volume partially offset by unfavorable pricing and
product mix, primarily in Europe. An extremely competitive European
pricing environment, combined with sales shifting to larger package sizes
that sell at lower per unit prices, account for the unfavorable pricing.
Gross margin declined $9.7 in 2006, including $7.0 of unfavorable
currency impact. Absent currencies, gross margin declined $2.7 in spite
of higher sales as the contribution of higher volume was more than offset
by unfavorable pricing and product mix and higher material costs. Overall
product cost was unfavorable $9.6 as higher material and distribution
costs of $16 were partially offset by other production cost savings.
Segment profit declined $1.2, including $4.2 unfavorable currency
impact. Absent currencies, segment profit increased 2% as lower A&P
expense more than offset gross margin declines and higher selling costs.
For the year ended September 30, 2005, net sales increased $58.9,
or 7%, on favorable currency impacts of $32.4 and contributions of
higher sales volume of $35.1, partially offset by unfavorable pricing and
product mix, primarily in Europe. Segment profit increased $26.1 for the
year, including a $15.8 favorable impact from currencies. Absent cur-
rencies, segment profit increased $10.3 as a $9.0 gross margin increase
from higher sales and lower A&P was partially offset by higher SG&A.
As discussed above, material costs will be unfavorable in 2007.
If product sold during 2006 had been produced at anticipated
2007 production costs, the result would have been additional costs of
$29 to $31. Pricing actions have been taken in 2006 in a number of
markets, with additional increases scheduled during 2007. Given the
competitive situation in many markets, it is not yet known whether
pricing in 2007 will be sufficient to offset product cost increases. Per
unit gross margin will continue to be unfavorable until the 2007 price
increase takes effect.
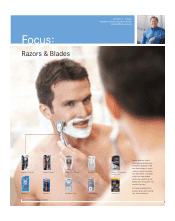
RAZORS AND BLADES
2006 2005 2004
Net sales $ 929.8 $ 930.8 $ 868.1
Segment profit $127.7 $ 107.5 $ 76.2
Razors and Blades sales in 2006 declined $1.0 in absolute dollars but
increased $17.5, or 2%, on a constant currency basis. The increase on a
constant currency basis reflects incremental sales of newly launched
products, partially offset by declines in older technology products.
Excluding currency impacts, Quattro for Women and Intuition contributed
$44 of sales growth while disposables and the men's Quattro franchise
grew $15 and $8, respectively. These increases were partially offset by
declines in older technology systems and ancillary product lines.
Segment profit increased $20.2 in absolute dollars and $27.8, or
26%, on a constant currency basis. Excluding currency, higher sales,
lower product cost and cost mix accounted for the bulk of the improved
profitability. In spite of higher commodities, plant cost containment
activities delivered net razors and blades product cost savings of $13.
In addition, the segment profit comparison benefited from several
one-time product cost items in the prior year that were not repeated
this year and a favorable cost mix. A&P expense declined $9.8 for the
year as significant reductions in early 2006 were partially offset by a