Energizer 2005 Annual Report Download - page 44
Download and view the complete annual report
Please find page 44 of the 2005 Energizer annual report below. You can navigate through the pages in the report by either clicking on the pages listed below, or by using the keyword search tool below to find specific information within the annual report.-
 1
1 -
2
-
3
-
4
-
5
-
6
-
7
-
8
-
9
-
10
-
11
-
12
-
13
-
14
-
15
-
16
-
17
-
18
-
19
-
20
-
21
-
22
-
23
-
24
-
25
-
26
-
27
-
28
-
29
-
30
-
31
-
32
-
33
-
 34
34 -
 35
35 -
 36
36 -
 37
37 -
 38
38 -
 39
39 -
 40
40 -
 41
41 -
 42
42 -
 43
43 -
 44
44 -
 45
45 -
 46
46 -
 47
47
 |
 |
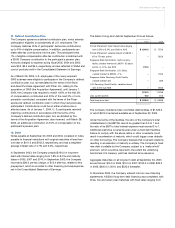
42 ENR 2005 Annual Report
ENERGIZER HOLDINGS, INC.
Notes to Consolidated Financial Statements
(Dollars in millions, except per share and percentage data)
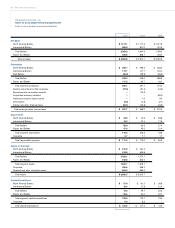
2005 2004 2003
Net Sales
North America Battery $1,173.1 $1,117.6 $ 1,041.9
International Battery 885.9 827.0 757.6
Total Battery 2,059.0 1,944.6 1,799.5
Razors and Blades 930.8 868.1 433.0
Total net sales $2,989.8 $2,812.7 $ 2,232.5
Profitability
North America Battery $ 295.7 $ 298.2 $ 283.5
International Battery 173.7 147.7 122.4
R&D Battery (36.0) (39.9) (36.0)
Total Battery 433.4 406.0 369.9
Razors and Blades 117.3 85.7 40.1
Total segment profitability 550.7 491.7 410.0
General corporate and other expenses (97.6) (81.4) (44.6)
Special pension termination benefits –(15.2) –
Acquisition inventoryvaluation –– (89.7)
Intellectual property rights income –1.5 8.5
Amortization (5.3) (5.8) (2.7)
Interest and other financial items (50.1) (32.8) (43.9)
Total earnings beforeincome taxes $397.7 $ 358.0 $237.6
Depreciation
North America Battery $43.9 $40.9 $ 39.8
International Battery 19.0 22.4 17.6
Total Battery 62.9 63.3 57.4
Razors and Blades 47.4 45.0 21.4
Total segment depreciation 110.3 108.3 78.8
Corporate 0.7 1.7 1.7
Total depreciation expense $111.0 $110.0 $ 80.5
Assets at Year-End
North America Battery $814.2 $764.3
International Battery 518.9 509.8
Total Battery 1,333.1 1,274.1
Razors and Blades 612.6 604.0
Total segment assets 1,945.7 1,878.1
Corporate 350.6 368.2
Goodwill and other intangible assets 664.0 669.4
Total assets $2,960.3 $2,915.7
Capital Expenditures
North America Battery $57.6 $61.2 $ 39.9
International Battery 15.4 17.9 12.4
Total Battery 73.0 79.1 52.3
Razors and Blades 29.6 34.0 20.7
Total segment capital expenditures 102.6 113.1 73.0
Corporate 0.4 8.3 –
Total capital expenditures $103.0 $121.4 $ 73.0