Energizer 2005 Annual Report Download - page 21
Download and view the complete annual report
Please find page 21 of the 2005 Energizer annual report below. You can navigate through the pages in the report by either clicking on the pages listed below, or by using the keyword search tool below to find specific information within the annual report.-
 1
1 -
2
-
3
-
4
-
5
-
6
-
7
-
8
-
9
-
10
-
 11
11 -
 12
12 -
 13
13 -
 14
14 -
 15
15 -
 16
16 -
 17
17 -
 18
18 -
 19
19 -
 20
20 -
 21
21 -
 22
22 -
 23
23 -
 24
24 -
 25
25 -
 26
26 -
 27
27 -
 28
28 -
 29
29 -
 30
30 -
 31
31 -
32
-
33
-
34
-
35
-
36
-
37
-
38
-
39
-
40
-
41
-
42
-
43
-
44
-
45
-
46
-
47
 |
 |

ENR 2005 Annual Report 19
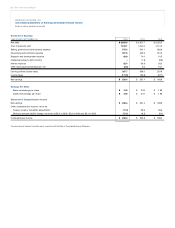
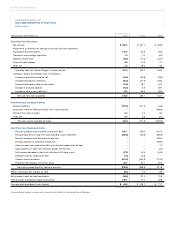
ENERGIZER HOLDINGS, INC.
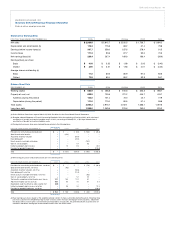
Summary Selected Historical Financial Information
(Dollars in millions, except per share data)
Statement of Earnings Data
FOR THE YEAR ENDED SEPTEMBER 30, 2005 2004 2003(a) 2002 2001
Net sales $2,989.8 $2,812.7 $ 2,232.5 $ 1,739.7 $ 1,694.2
Depreciation and amortization (b) 116.3 115.8 83.2 57.4 79.8
Earnings before income taxes (c) 397.7 358.0 237.6 278.4 31.5
Income taxes 111.3 90.6 67.7 92.0 70.5
Net earnings/(loss) (d) 286.4 267.4 169.9 186.4 (39.0)
Earnings/(loss) per share:
Basic $ 4.03 $3.32 $ 1.98 $ 2.05 $ (0.42)
Diluted $ 3.90 $3.21 $ 1.93 $ 2.01 $ (0.42)
Average shares outstanding (e)
Basic 71.0 80.6 85.9 91.0 92.6
Diluted 73.5 83.4 88.2 92.8 94.1
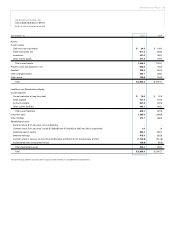
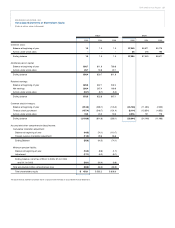
Balance Sheet Data
SEPTEMBER 30, 2005 2004 2003(a) 2002 2001
Working capital $625.9 $468.8 $ 515.6 $ 353.3 $ 288.1
Property at cost, net 682.5 705.6 701.2 455.7 476.1
Additions (during the period) 103.0 121.4 73.0 40.7 77.9
Depreciation (during the period) 111.0 110.0 80.5 57.4 58.6
Total assets 2,960.3 2,915.7 2,732.1 1,588.1 1,497.6
Long-term debt 1,295.0 1,059.6 913.6 160.0 225.0
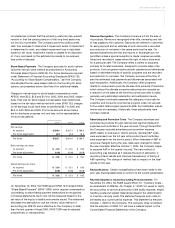
(a) Schick-Wilkinson Sword was acquired March 28, 2003. See Note 3 to the Consolidated Financial Statements.
(b) Energizer adopted Statement of Financial Accounting Standards 142 at the beginning of fiscal year 2002, which eliminated
amortization of goodwill and certain intangible assets. In 2001, net earnings included $15.1, or $0.16 per diluted share of
amortization of goodwill and certain intangible assets.
(c) Earnings before income taxes were (reduced)/increased due to the following items:
FOR THE YEAR ENDED SEPTEMBER 30, 2005 2004 2003 2002 2001
Provisions for restructuring and related costs $–$ – $ (0.2) $ (10.3) $ (29.8)
Special termination benefits –(15.2) –––
Acquisition inventory valuation –– (89.7) – –
Early debt payoff––(20.0) – –
Kmartaccounts receivable write-down –––(15.0) –
Gain on sale of property –– 5.7 6.3 –
Intellectual property rights income –1.5 8.5 –20.0
Provision for goodwill impairment ––– – (119.0)
Total $–$(13.7) $ (95.7) $ (19.0) $ (128.8)
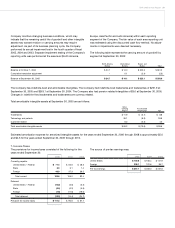
(d) Net earnings/(loss) were (reduced)/increased due to the following items:
FOR THE YEAR ENDED SEPTEMBER 30, 2005 2004 2003 2002 2001
Provisions for restructuring and related costs, net of tax $– $ – $ – $ (7.8) $ (19.4)
Special termination benefits, net of tax –(9.6) – – –
Acquisition inventory valuation, net of tax –– (58.3) – –
Early debt payoff, net of tax –– (12.4) – –
Kmartaccounts receivable write-down, net of tax –– – (9.3) –
Gain on sale of property, net of tax –– 5.7 5.0 –
Tax benefits recognized related to prior years’ losses 14.7 16.2 12.2 6.7 –
Adjustment to prior year tax accruals 10.6 8.5 7.0 5.1 3.5
Repatriation under the American Jobs Creation Act (9.0) ––––
Intellectual property rights income, net of tax –0.9 5.2 – 12.3
Provision for goodwill impairment, net of tax ––––(119.0)
Total $16.3 $16.0 $(40.6) $ (0.3) $ (122.6)
(e) Basic earnings per share is based on the weighted-average number of shares outstanding during the period. Diluted earnings
per shareis based on the weighted-average number of shares used in the basic earnings per sharecalculation, adjusted for
the dilutive effect of stock options and restricted stock equivalents. In fiscal 2001, the potentially dilutive securities were not
included in the dilutive earnings per share calculation due to their anti-dilutive effect.