Energizer 2005 Annual Report Download - page 13
Download and view the complete annual report
Please find page 13 of the 2005 Energizer annual report below. You can navigate through the pages in the report by either clicking on the pages listed below, or by using the keyword search tool below to find specific information within the annual report.-
 1
1 -
2
-
 3
3 -
 4
4 -
 5
5 -
 6
6 -
 7
7 -
 8
8 -
 9
9 -
 10
10 -
 11
11 -
 12
12 -
 13
13 -
 14
14 -
 15
15 -
 16
16 -
 17
17 -
 18
18 -
 19
19 -
 20
20 -
 21
21 -
 22
22 -
 23
23 -
24
-
25
-
26
-
27
-
28
-
29
-
30
-
31
-
32
-
33
-
34
-
35
-
36
-
37
-
38
-
39
-
40
-
41
-
42
-
43
-
44
-
45
-
46
-
47
 |
 |

ENR 2005 Annual Report 11
Current year net earnings include the following items, stated on an
after-tax basis: income tax benefits related to prior year losses and
adjustments to prior year tax accruals of $25.3, which were partially
offset by $9.0 of additional taxes related to repatriation of foreign
earnings under provisions of the American Jobs Creation Act. Fiscal
2004 net earnings included the following on an after-tax basis:
income tax benefits related to prior year losses and adjustments to
prior year tax accruals of $24.7, partially offset by a charge for spe-
cial termination pension benefits of $9.6. Fiscal 2003 net earnings
included the following on an after-tax basis: expense associated with
the write-up of inventory purchased in the SWS acquisition (SWS
inventory write-up) of $58.3; a charge of early payment of long-term
debt of $12.4; gain on the sale of property of $5.7; intellectual
property rights income of $5.2; and tax benefits of $19.2 related to
prior year losses and adjustments to prior year tax accruals.
Operating Results
Net Sales
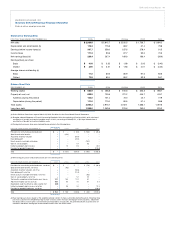
Net sales increased $177.1, or 6%, in 2005 compared to 2004 with
contributions from each business segment, as more fully described
in Segment Results below. Favorable currency translation accounted
for $63.6 of the current year sales increase. Net sales increased
$580.2, or 26%, in 2004 compared to 2003, primarily due to the
inclusion of SWS sales for a full year in 2004 and six months
in 2003 following the midyear acquisition. Global batterysales
increased $145.1 in 2004 on higher volume and favorable currency
translation impacts of $59.3.
Gross Margin
Gross margin dollars increased $69.0 in 2005 on higher sales.
Gross margin percentage was 49.4% in 2005 compared to 50.1%
in 2004 due to declines in the North America Battery segment.
Gross margin dollars increased $450.4 in 2004, primarily due to the
SWS acquisition. Gross margin percentage was 50.1% of sales in
2004 compared to 42.9% in 2003, the latter percentage including
afour percentage point reduction due to the impact of higher cost
of products sold in 2003 related to the SWS inventorywrite-up, as
discussed in Note 3 to the Consolidated Financial Statements.
Absent the SWS inventory write-up, gross margin for 2003 would
have been 46.9%, resulting in a 3.2 percentage point increase in
2004, reflecting the relatively higher margins of the SWS business
versus the battery business. See Segment Results for a discussion
of gross margin in each operating segment.
Selling, General and Administrative
Selling, general and administrative expense (SG&A) increased $30.3
in 2005 primarily on higher corporate costs, as well as $11.8 due
to unfavorable currency translation. SG&A increased $159.3 in 2004
primarily due to the SWS acquisition. Additionally, the 2004 increase
reflects the impact of higher currency rates of $21.9, special termina-
tion benefits of $15.2 and higher battery overhead spending of $14.6.
SG&A expenses were19.1%, 19.3% and 17.1% of sales in 2005,
2004 and 2003, respectively. The percentage is relatively flat from
2004 to 2005 as higher corporate costs werebasically offset by the
absence of the special termination benefit charge discussed above.
The increased percentage from 2003 to 2004 reflects the inclusion
of SWS for a full year, which has a higher SG&A percentage than
the rate for the remainder of the Company, as well as special termi-
nation benefits, higher legal expenses and integration associated
with the SWS acquisition.
Advertising and Promotion
Advertising and promotion (A&P) expense decreased $15.7 in 2005
on lower spending in all segments, partially offset by higher currency
translation of $7.8. A&P increased $152.3 in 2004 compared to 2003
due to the inclusion of SWS for a full year. The remainder of the
increase reflects significantly higher SWS spending, currency trans-
lation impacts and increases in the Battery segments. A&P expense
was 13.0%, 14.3% and 11.2% of sales for 2005, 2004 and 2003,
respectively. Had SWS been included for the full year in 2003, the
percentage for that year would have been 12.1%. The higher per-
centage in 2004 reflects primarily the level of SWS product launch
activities and A&P related thereto. A&P expense can vary from year
to year with new product launches, strategic brand support initia-
tives and the overall competitive environment.
Research and Development
Research and development expense was $69.9 in 2005, $74.0 in
2004 and $51.5 in 2003. The 2004 expense includes a $4.2 asset
impairment charge related to a discontinued technology develop-
ment initiative. The remainder of the increase from 2003 spending
is primarily due to the SWS acquisition. As a percent of sales,
research and development expense was 2.3% in 2005, 2.6% in
2004 and 2.3% in 2003.
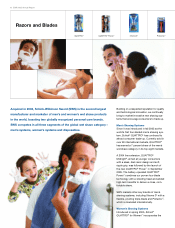
Segment Results
Operations for the Company aremanaged via three major segments
–North America Battery (U.S. and Canada battery and lighting
products), International Battery (rest of world battery and lighting
products) and Razors and Blades (global razors, blades, and related
products). The Company reports segment results reflecting all profit
derived from each outside customer sale in the region in which
the customer is located. Research and development costs for the
battery segments are combined and included in the Total Battery
segment results. Research and development costs for Razors and
Blades are included in that segment’s results. Segment performance
is evaluated based on segment operating profit exclusive of general
corporate expenses, costs associated with most restructuring, inte-
gration or business realignment and amortization of intangible
assets. Financial items, such as interest income and expense, are
managed on a global basis at the corporate level. This structure is
the basis for the Company’s reportable operating segment informa-
tion presented in Note 19 to the Consolidated Financial Statements.
On March 28, 2003, the Company acquired the worldwide SWS
business from Pfizer, Inc. Following the acquisition of SWS, the
Company has adopted an operating model that includes a combina-
tion of stand-alone and combined business functions between the