Energizer 2005 Annual Report Download - page 26
Download and view the complete annual report
Please find page 26 of the 2005 Energizer annual report below. You can navigate through the pages in the report by either clicking on the pages listed below, or by using the keyword search tool below to find specific information within the annual report.-
 1
1 -
2
-
3
-
4
-
5
-
6
-
7
-
8
-
9
-
10
-
11
-
12
-
13
-
14
-
15
-
 16
16 -
 17
17 -
 18
18 -
 19
19 -
 20
20 -
 21
21 -
 22
22 -
 23
23 -
 24
24 -
 25
25 -
 26
26 -
 27
27 -
 28
28 -
 29
29 -
 30
30 -
 31
31 -
 32
32 -
 33
33 -
 34
34 -
 35
35 -
 36
36 -
37
-
38
-
39
-
40
-
41
-
42
-
43
-
44
-
45
-
46
-
47
 |
 |

24 ENR 2005 Annual Report
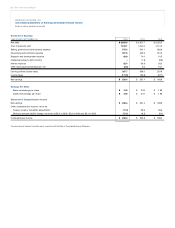
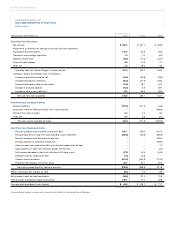
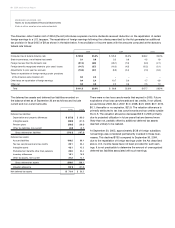
ENERGIZER HOLDINGS, INC.
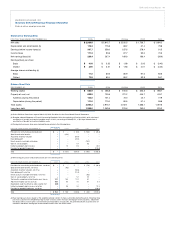
Consolidated Statement of Cash Flows
(Dollars in millions)
YEAR ENDED SEPTEMBER 30, 2005 2004 2003
Cash Flow from Operations
Net earnings $286.4 $ 267.4 $ 169.9
Adjustments to reconcile net earnings to net cash flow from operations:
Depreciation and amortization 116.3 115.8 83.2
Translation and exchange (gain)/loss 1.4 1.5 (0.2)
Deferred income taxes (12.3) (14.4) (24.7)
Other non-cash charges 5.8 14.8 2.7
Other, net 3.4 19.6 9.3
Operating cash flow before changes in working capital 401.0 404.7 240.2
Changes in assets and liabilities used in operations:
Increase in accounts receivable, net (46.0) (62.8) (70.6)
(Increase)/decrease in inventories (30.3) (21.9) 148.0
(Increase)/decrease in other current assets (10.8) 78.1 50.2
Increase in accounts payable (10.4) 3.8 38.1
Increase in other current liabilities 13.3 83.8 36.2
Net cash flow from operations 316.8 485.7 442.1
Cash Flow from Investing Activities
Property additions (103.0) (121.4) (73.0)
Acquisition of Schick-Wilkinson Sword, net of cash acquired –– (960.9)
Proceeds from sale of assets 5.4 4.3 9.0
Other, net 0.5 5.8 (0.1)
Net cash used by investing activities (97.1) (111.3) (1,025.0)
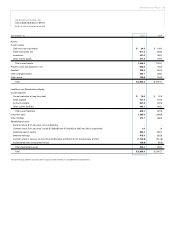
Cash Flow from Financing Activities
Net cash proceeds from issuance of long-term debt 610.7 205.0 1,341.4
Principal payments on long-term debt (including current maturities) (382.8) (62.9) (590.2)
Net cash proceeds from acquisition bridge loan –– 550.0
Principal payment of acquisition bridge loan –– (550.0)
Cash proceeds from issuance of debt with maturities greater than 90 days –– 7.0
Cash payments on debt with maturities greater than 90 days –– (7.0)
Net increase/(decrease) in debt with maturities of 90 days or less (47.3) 44.8 (34.4)
Restricted cash as collateral for debt (1.3) (3.6) –
Common stock purchased (461.2) (542.9) (131.4)
Proceeds from issuance of common stock 39.7 20.7 26.4
Net cash provided/(used) by financing activities (242.2) (338.9) 611.8
Effect of exchange rate changes on cash (2.1) 1.9 8.9
Net increase in cash and cash equivalents (24.6) 37.4 37.8
Cash and cash equivalents, beginning of period 109.1 71.7 33.9
Cash and cash equivalents, end of period $84.5 $ 109.1 $ 71.7
The above financial statement should be read in conjunction with the Notes to Consolidated Financial Statements.