Energizer 2005 Annual Report Download - page 16
Download and view the complete annual report
Please find page 16 of the 2005 Energizer annual report below. You can navigate through the pages in the report by either clicking on the pages listed below, or by using the keyword search tool below to find specific information within the annual report.-
 1
1 -
2
-
3
-
4
-
5
-
 6
6 -
 7
7 -
 8
8 -
 9
9 -
 10
10 -
 11
11 -
 12
12 -
 13
13 -
 14
14 -
 15
15 -
 16
16 -
 17
17 -
 18
18 -
 19
19 -
 20
20 -
 21
21 -
 22
22 -
 23
23 -
 24
24 -
 25
25 -
 26
26 -
27
-
28
-
29
-
30
-
31
-
32
-
33
-
34
-
35
-
36
-
37
-
38
-
39
-
40
-
41
-
42
-
43
-
44
-
45
-
46
-
47
 |
 |

14 ENR 2005 Annual Report
¨In 2005, 2004 and 2003, $14.7, $16.2 and $12.2, respectively, of tax
benefits related to prior years’ losses were recorded. These were related
to foreign countries where the Company generated earnings and could
reasonably expect future profitability.
¨Adjustments were recorded in each of the three years to revise previously
recorded tax accruals, which were based on estimates when recorded.
Such adjustments decreased the income tax provision by $10.6, $8.5
and $7.0 in 2005, 2004 and 2003, respectively.
¨The current year includes $9.0 of additional taxes related to repatriation
of foreign earnings under provisions of the American Jobs Creation Act,
which provides for an 85% exclusion of qualifying dividends from normal
U.S. tax rates.
¨The tax benefit related to the write-up of acquired SWS inventory of
$89.7, all of which was recorded to cost of products sold in 2003, was
higher than the overall tax rate for the remainder of the business, and
thus reduced the overall tax rate by 1.8 percentage points.
Excluding the items discussed above, the income tax percentage
was 32.1% in 2005, 32.2% in 2004 and 36.1% in 2003. The
improved tax rate in 2004 reflects a significantly lower rate on
foreign income due to improved foreign earnings and overall
country mix. Such improvements reflect better battery results
as well as a favorable impact from the inclusion of SWS.
The Company’seffective tax rate is highly sensitive to country
mix from which earnings or losses are derived. To the extent future
earnings levels and countrymix aresimilar to the 2005 level and
excluding any unusual or non-recurring tax items, futuretax rates
would likely be in the 31-33% range. Declines in earnings in lower
tax rate countries, earnings increases in higher tax countries or
operating losses in the future could increase future tax rates.
Additionally,adjustments to prior year tax accrual estimates could
increase or decrease future tax provisions.
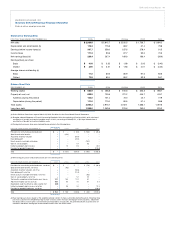
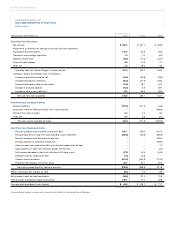
Liquidity and Capital Resources
Cash flow from operations was $316.8 in 2005, a decrease of
$168.9 from 2004. The primary reasons for the decline relates to
working capital changes, while “operating cash flow before changes
in working capital” was roughly flat. Working capital was $625.9
and $468.8 at September 30, 2005 and 2004, respectively. Working
capital changes reflect higher accounts receivable, inventories and
other current assets, and lower short-term debt. Receivables are
higher primarily due to the launch of new products in the Razors
and Blades segment in late September 2005. Inventories are higher
primarily for North America Battery due to relatively low levels at
the end of 2004 following a high-demand hurricane season.
In 2004, cash flow from operations totaled $485.7, an increase of
$43.6 from 2003. The increase was due to higher “operating cash
flow beforechanges in working capital” of $164.5, partially offset by
lower conversion of working capital items to cash. The 2003 cash
flow reflects an unusually large change in inventory balance primarily
due to the SWS inventory write-up discussed in Note 3, which
accounts for the decline in 2004.
Capital expenditures totaled $103.0, $121.4 and $73.0 in 2005,
2004 and 2003, respectively. These expenditures were funded by
cash flow from operations. Capital expenditures decreased in 2005
due to lower production project spending in both businesses and
lower integration capital spending. Capital expenditures increased
in 2004 as a result of increases for battery production projects,
inclusion of SWS for a full year and corporate expenditures. See
Note 19 of the Consolidated Financial Statements for capital expen-
ditures by segment. Capital expenditures of approximately $113
are anticipated in 2006. Such expenditures are expected to be
financed with funds generated from operations.
Total long-term debt outstanding, including current maturities, was
$1,310.0 at September 30, 2005. The Company maintains total
committed debt facilities of $1,625.0, of which $315.0 remained
available as of September 30, 2005.
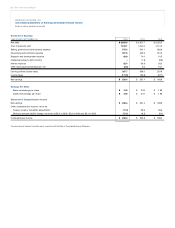
Asummary of the Company’s significant contractual obligations at
September 30, 2005 is shown below:
Less More
Than 1-3 3-5 Than
Total 1Year Years Years 5 Years
Long-term debt,
including current
maturities $1,310.0 $ 15.0 $ 145.0 $ 625.0 $ 525.0
Notes payable 101.2 101.2 – – –
Operating leases 53.4 14.0 18.7 12.5 8.2
Total $1,464.6 $130.2 $ 163.7 $ 637.5 $ 533.2
In November 2004, the Company entered into two new financing
agreements. A $300.0 long-term debt financing was completed,
with three, five and seven year maturities with fixed rates ranging
from 3.4% to 4.4%. Proceeds from these notes were used to pay
down all existing long-termdebt in a revolving credit facility and to
partially retire short-term debt within a secured financing arrange-
ment. In addition, the Company renegotiated its existing U.S. revolv-
ing credit facility in order to extend the maturity to five years and
to realize more favorable borrowing spreads. In August 2005, the
Company entered into a new Singaporemulti-currency syndication
of $325.0 in order to extend the maturity to 2010 and to realize more
favorable borrowing spreads. Proceeds from this borrowing were
used to refinance an existing revolving credit facility in Singapore,
allow for the repayment of intercompany debt and notes, and the
repatriation of funds in connection with the American Jobs Creation
Act. During September 2005, the Company refinanced $325.0 of
variable interest private placement debt with $325.0 of fixed rate
private placement debt with interest rates ranging from 4.9% to
5.2% and maturities from 2008 to 2015.
Under the terms of the Company’s debt facilities, the ratio of the
Company’s total indebtedness to its Earnings Before Interest, Taxes,
Depreciation and Amortization (EBITDA) (as defined by the facility
agreement) cannot be greater than 3.5 to 1, and the ratio of its
ENERGIZER HOLDINGS, INC.
Management’s Discussion and Analysis of Results of Operations and Financial Condition
(Dollars in millions, except per share and percentage data)