Energizer 2005 Annual Report Download - page 14
Download and view the complete annual report
Please find page 14 of the 2005 Energizer annual report below. You can navigate through the pages in the report by either clicking on the pages listed below, or by using the keyword search tool below to find specific information within the annual report.-
 1
1 -
2
-
3
-
 4
4 -
 5
5 -
 6
6 -
 7
7 -
 8
8 -
 9
9 -
 10
10 -
 11
11 -
 12
12 -
 13
13 -
 14
14 -
 15
15 -
 16
16 -
 17
17 -
 18
18 -
 19
19 -
 20
20 -
 21
21 -
 22
22 -
 23
23 -
 24
24 -
25
-
26
-
27
-
28
-
29
-
30
-
31
-
32
-
33
-
34
-
35
-
36
-
37
-
38
-
39
-
40
-
41
-
42
-
43
-
44
-
45
-
46
-
47
 |
 |

12 ENR 2005 Annual Report
ENERGIZER HOLDINGS, INC.
Management’s Discussion and Analysis of Results of Operations and Financial Condition
(Dollars in millions, except per share and percentage data)
battery and razor and blades businesses, varying by country and
region of the world. Shared functions include product warehousing
and distribution, various transaction processing functions, legal and
environmental activities, and in some countries, combined sales
forces and management. For shared business functions, the Razors
and Blades segment has been charged only the actual incremental
cost of assuming additional SWS work. Such amounts are less than
fully allocated costs and do not represent the costs of such services
if performed on a stand-alone basis.
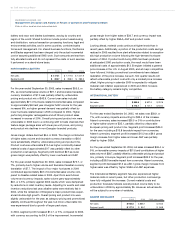
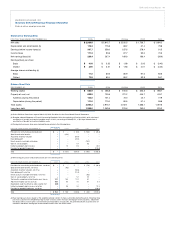
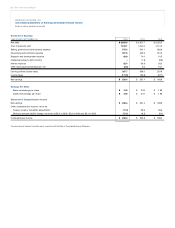
NORTH AMERICA BATTERY
2005 2004 2003
Net sales $1,173.1 $1,117.6 $ 1,041.9
Segment profit $ 295.7 $298.2 $ 283.5
For the year ended September 30, 2005, sales increased $55.5, or
5%, as incremental sales volume of $91.1 and favorable Canadian
currency translation of $7.3 was partially offset by unfavorable
pricing and product mix of $42.9. Current year sales included
approximately $21 of hurricane-related incremental sales compared
to approximately $40 last year. Energizer MAX volume for the year
increased 8%, as higher general demand was partially offset by
lower hurricane-related sales in 2005 compared to 2004. Higher
performing Energizer rechargeable and e2 lithium product sales
increased in excess of 20%. Overall pricing and product mix were
unfavorable in 2005 due to a continuing shift to trade channels that
feature larger package sizes with lower per-unit prices, and pricing
and product mix declines in non-Energizer branded products.
Gross margin dollars declined $6.4 in 2005. The margin contribution
of higher sales volume and favorable currency translation of $6.6
weresubstantially offset by unfavorable pricing and product mix.
Product cost was unfavorable $13.4 as higher commodity-based
material costs of approximately $17 was partially offset by other
production cost savings. Segment profit declined $2.5 as lower
gross margin was partially offset by lower overheads and A&P.
For the year ended September 30, 2004, sales increased $75.7, or
7%, primarily due to higher volume and favorable Canadian currency
translation of $7.7. The impact of four major hurricanes in 2004
contributed approximately $22 of incremental sales volume com-
pared to disaster-related sales in 2003. Apart from event-driven
volume and currency impacts, sales volume grew approximately
$46, or 4.5%, primarily against 2003 results which weredampened
by reductions in retail inventory levels. Adjusting for events and retail
inventory reductions last year,alkaline sales wererelatively flat in
2004, while the remainder of Energizer’s major product lines experi-
enced double-digit growth. Overall pricing and product mix were
slightly unfavorable for the year,as categorypricing and promotional
stability continued throughout the year, but minor unfavorable mix
was experienced due to growth of larger pack sizes.
In 2004, segment profit increased $14.7, or 5%, compared to 2003,
with currency accounting for $4.3 of the improvement. Incremental
gross margin from higher sales of $30.7 and currency impact was
partially offset by higher SG&A, A&P and product costs.
Looking ahead, material costs continue at higher levels than in
recent years. Additionally, a portion of the production costs savings
realized in 2005 resulted from plant efficiencies related to exception-
ally high production volume following the high-demand hurricane
season of 2004. If product sold during 2005 had been produced
at anticipated 2006 production costs, the result would have been
additional costs of approximately $13. Energizer initiated a general
price increase in the U.S. in August 2005, and all major competitors
have followed. Holiday promotional commitments have delayed
realization of the price increase. As such, first quarter results will
reflect unfavorable product cost with only a modest price increase
offset. Higher pricing in calendar 2006 is expected to mitigate
material cost inflation experienced in 2005 and 2004; however,
the battery category remains highly competitive.
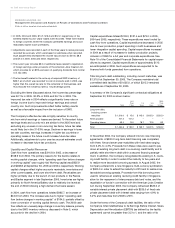
INTERNATIONAL BATTERY
2005 2004 2003
Net sales $ 885.9 $827.0 $757.6
Segment profit $ 173.7 $147.7 $ 122.4
For the year ended September 30, 2005, net sales rose $58.9, or
7%, with currency impacts accounting for $32.4 of the increase.
Absent currencies, sales increased $26.5 or 3% on contributions
of higher sales volume of $35.1, partially offset by unfavorable
European pricing and product mix. Segment profit increased $26.0
for the year, including a $15.8 favorable impact from currencies.
Absent currencies, segment profit increased $10.2 as a $9.0 gross
margin increase from higher sales and lower A&P was partially
offset by higher SG&A.
For the year ended September 30, 2004, net sales increased $69.4, or
9%, on favorable currency impacts of $51.6 and contributions of higher
sales volume of $28.7, partially offset by unfavorable pricing and product
mix, primarily in Europe. Segment profit increased $25.3 for the year,
including a $26.6 favorable impact from currencies. Absent currencies,
segment profit decreased $1.3 as a $6.1 gross margin increase from
higher sales was offset by higher SG&A and A&P expenses.
The International Batterysegment has also experienced higher
material costs in recent years, but other production cost savings
have fully mitigated the increase. Current material costs and
production forecasts indicate overall product cost is likely to be
unfavorable in 2006 by approximately $5. However,actual results
will be subject to a number of variables.
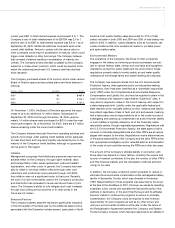
RAZORS AND BLADES
2005 2004 2003 PRO FORMA
Net sales $930.8 $868.1 $745.0
Segment profit $117.3 $ 85.7 $ 56.9