Energizer 2001 Annual Report Download - page 52
Download and view the complete annual report
Please find page 52 of the 2001 Energizer annual report below. You can navigate through the pages in the report by either clicking on the pages listed below, or by using the keyword search tool below to find specific information within the annual report.-
 1
1 -
2
-
3
-
4
-
5
-
6
-
7
-
8
-
9
-
10
-
11
-
12
-
13
-
14
-
15
-
16
-
17
-
18
-
19
-
20
-
21
-
22
-
23
-
24
-
25
-
26
-
27
-
28
-
29
-
30
-
31
-
32
-
33
-
34
-
35
-
36
-
37
-
38
-
39
-
40
-
41
-
 42
42 -
 43
43 -
 44
44 -
 45
45 -
 46
46 -
 47
47 -
 48
48 -
 49
49 -
 50
50 -
 51
51 -
 52
52 -
 53
53 -
 54
54 -
 55
55 -
 56
56 -
 57
57 -
 58
58 -
 59
59 -
 60
60
 |
 |

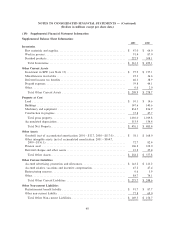
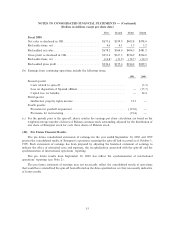
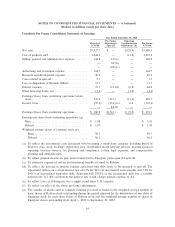
NOTES TO CONSOLIDATED FINANCIAL STATEMENTS Ì (Continued)
(Dollars in millions except per share data)
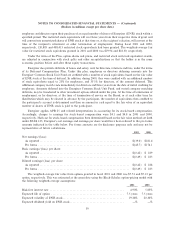
Allowance for Doubtful Accounts:
2001 2000 1999
Balance at beginning of year ÏÏÏÏÏÏÏÏÏÏÏÏÏÏÏÏÏÏÏÏÏÏÏÏÏÏÏÏÏÏÏÏÏÏÏÏÏÏÏÏÏÏÏÏÏ $12.5 $19.3 $19.6
Provision charged to expenseÏÏÏÏÏÏÏÏÏÏÏÏÏÏÏÏÏÏÏÏÏÏÏÏÏÏÏÏÏÏÏÏÏÏÏÏÏÏÏÏÏÏÏÏÏ 2.8 5.1 6.7
Write-oÅs, less recoveriesÏÏÏÏÏÏÏÏÏÏÏÏÏÏÏÏÏÏÏÏÏÏÏÏÏÏÏÏÏÏÏÏÏÏÏÏÏÏÏÏÏÏÏÏÏÏÏÏ (3.9) (5.9) (7.0)
Transfer to SPE (see Note 13) ÏÏÏÏÏÏÏÏÏÏÏÏÏÏÏÏÏÏÏÏÏÏÏÏÏÏÏÏÏÏÏÏÏÏÏÏÏÏÏÏÏÏ 0.4 (6.0) Ì
Balance at end of year ÏÏÏÏÏÏÏÏÏÏÏÏÏÏÏÏÏÏÏÏÏÏÏÏÏÏÏÏÏÏÏÏÏÏÏÏÏÏÏÏÏÏÏÏÏÏÏÏÏÏ $11.8 $12.5 $19.3
Supplemental Cash Flow Statement Information:
2001 2000 1999
Interest paidÏÏÏÏÏÏÏÏÏÏÏÏÏÏÏÏÏÏÏÏÏÏÏÏÏÏÏÏÏÏÏÏÏÏÏÏÏÏÏÏÏÏÏÏÏÏÏÏÏÏÏÏÏÏÏÏÏÏÏ $36.1 $19.5 $11.7
Income taxes paidÏÏÏÏÏÏÏÏÏÏÏÏÏÏÏÏÏÏÏÏÏÏÏÏÏÏÏÏÏÏÏÏÏÏÏÏÏÏÏÏÏÏÏÏÏÏÏÏÏÏÏÏÏÏ 83.1 86.5 44.0
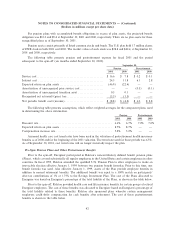
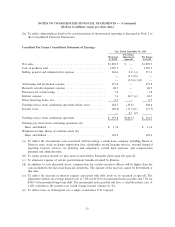
(20) Segment Information
Energizer manufactures and markets dry cell batteries including alkaline, carbon zinc, miniature and
specialty batteries, and Öashlights and other lighting products throughout the world. Operations are managed
via four major geographic areas Ì North America (the United States, Canada and Caribbean), Asia PaciÑc,
Europe, and South and Central America (including Mexico). This structure is the basis for Energizer's
reportable operating segment information disclosed below. Segment performance is evaluated based on
operating proÑt, exclusive of general corporate expenses, restructuring charges and amortization of goodwill
and intangibles. Financial items, such as interest income and expense, are managed on a global basis at the
corporate level.
Intersegment sales are generally valued at market-based prices and represent the diÅerence between total
sales and external sales as presented in the table below. Segment proÑtability includes proÑt on these
intersegment sales. One single mass merchandiser accounted for 16.6%, 15.3% and 13.5% of total net sales in
2001, 2000 and 1999, respectively, primarily in North America.
2001 2000 1999
Total External Total External Total External
Net Sales Sales Sales Sales Sales Sales Sales
North AmericaÏÏÏÏÏÏÏÏÏÏÏÏÏÏÏÏÏÏÏ $1,068.8 $ 970.6 $1,228.2 $1,123.9 $1,131.1 $1,031.1
Asia PaciÑcÏÏÏÏÏÏÏÏÏÏÏÏÏÏÏÏÏÏÏÏÏÏ 373.8 329.0 465.2 395.5 432.0 386.8
EuropeÏÏÏÏÏÏÏÏÏÏÏÏÏÏÏÏÏÏÏÏÏÏÏÏÏÏ 264.1 261.4 287.1 278.6 326.1 322.8
South and Central America ÏÏÏÏÏÏÏÏ 143.2 133.2 147.5 129.7 154.4 137.8
Total Net Sales ÏÏÏÏÏÏÏÏÏÏÏÏÏÏ $1,694.2 $1,927.7 $1,878.5
49