Energizer 2001 Annual Report Download - page 37
Download and view the complete annual report
Please find page 37 of the 2001 Energizer annual report below. You can navigate through the pages in the report by either clicking on the pages listed below, or by using the keyword search tool below to find specific information within the annual report.-
 1
1 -
2
-
3
-
4
-
5
-
6
-
7
-
8
-
9
-
10
-
11
-
12
-
13
-
14
-
15
-
16
-
17
-
18
-
19
-
20
-
21
-
22
-
23
-
24
-
25
-
26
-
 27
27 -
 28
28 -
 29
29 -
 30
30 -
 31
31 -
 32
32 -
 33
33 -
 34
34 -
 35
35 -
 36
36 -
 37
37 -
 38
38 -
 39
39 -
 40
40 -
 41
41 -
 42
42 -
 43
43 -
 44
44 -
 45
45 -
 46
46 -
 47
47 -
48
-
49
-
50
-
51
-
52
-
53
-
54
-
55
-
56
-
57
-
58
-
59
-
60
 |
 |

NOTES TO CONSOLIDATED FINANCIAL STATEMENTS Ì (Continued)
(Dollars in millions except per share data)
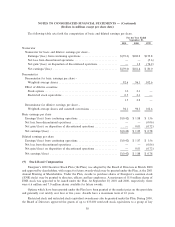
The following table presents, by major cost component and by year of provision, activity related to the
restructuring charges discussed above during Ñscal years 2001, 2000 and 1999, including any adjustments to
the original charges.
1999 Rollforward 2000 Rollforward 2001 Rollforward
Beginning Provision/ Ending Beginning Provision/ Ending Beginning Provision/ Ending
Balance (Reversals) Activity Balance Balance (Reversals) Activity Balance Balance (Reversals) Activity Balance
Prior Plans
Termination
benefits ÏÏÏÏÏÏ $33.9 $ 6.4 $(34.6) $ 5.7 $ 5.7 $ Ì $(5.7) $ Ì $ Ì $ Ì $ Ì $ Ì
Other cash costs 7.1 2.3 (4.5) 4.9 4.9 Ì (1.0) 3.9 3.9 Ì (3.9) Ì
Fixed asset
impairments ÏÏ Ì (5.4) 5.4 Ì Ì Ì Ì Ì Ì Ì Ì Ì
Other non-cash
charges ÏÏÏÏÏÏ Ì (0.8) 0.8 Ì Ì Ì Ì Ì Ì Ì Ì Ì
Total ÏÏÏÏÏÏÏÏ 41.0 2.5 (32.9) 10.6 10.6 Ì (6.7) 3.9 3.9 Ì (3.9) Ì
1999 Plan
Termination
benefits ÏÏÏÏÏÏ Ì 3.2 (2.5) 0.7 0.7 Ì (0.7) Ì Ì Ì Ì Ì
Other cash costs Ì 0.2 (0.2) Ì Ì Ì Ì Ì Ì Ì Ì Ì
Fixed asset
impairments ÏÏ Ì 4.0 (4.0) Ì Ì Ì Ì Ì Ì Ì Ì Ì
Total ÏÏÏÏÏÏÏÏ Ì 7.4 (6.7) 0.7 0.7 Ì (0.7) Ì Ì Ì Ì Ì
2001 Plan
Termination
benefits ÏÏÏÏÏÏ Ì Ì Ì Ì Ì Ì Ì Ì Ì 14.6 (9.3) 5.3
Other cash costs Ì Ì Ì Ì Ì Ì Ì Ì Ì 4.1 (0.2) 3.9
Fixed asset
impairments ÏÏ Ì Ì Ì Ì Ì Ì Ì Ì Ì 11.1 (11.1) Ì
Total ÏÏÏÏÏÏÏÏ Ì Ì Ì Ì Ì Ì Ì Ì Ì 29.8 (20.6) 9.2
Grand Total $41.0 $ 9.9 $(39.6) $11.3 $11.3 $ Ì $(7.4) $3.9 $3.9 $29.8 $(24.5) $9.2
(6) Europe Goodwill
Energizer monitors changing business conditions, which may indicate that the remaining useful life of
goodwill and other intangible assets may warrant revision or carrying amounts may require adjustment.
Continuing unfavorable business trends in Europe, and the unfavorable costs of U.S. dollar-based products
resulting from currency declines, represent such conditions. As part of its annual business planning cycle,
Energizer performed a thorough evaluation of its European business in the fourth quarter of Ñscal 2001, which
resulted in a provision for goodwill impairment of $119.0. As of September 30, 2001, the remaining carrying
amount of goodwill related to Energizer's European business after the provision for impairment was $8.5.
34