Energizer 2001 Annual Report Download - page 38
Download and view the complete annual report
Please find page 38 of the 2001 Energizer annual report below. You can navigate through the pages in the report by either clicking on the pages listed below, or by using the keyword search tool below to find specific information within the annual report.-
 1
1 -
2
-
3
-
4
-
5
-
6
-
7
-
8
-
9
-
10
-
11
-
12
-
13
-
14
-
15
-
16
-
17
-
18
-
19
-
20
-
21
-
22
-
23
-
24
-
25
-
26
-
27
-
 28
28 -
 29
29 -
 30
30 -
 31
31 -
 32
32 -
 33
33 -
 34
34 -
 35
35 -
 36
36 -
 37
37 -
 38
38 -
 39
39 -
 40
40 -
 41
41 -
 42
42 -
 43
43 -
 44
44 -
 45
45 -
 46
46 -
 47
47 -
 48
48 -
49
-
50
-
51
-
52
-
53
-
54
-
55
-
56
-
57
-
58
-
59
-
60
 |
 |

NOTES TO CONSOLIDATED FINANCIAL STATEMENTS Ì (Continued)
(Dollars in millions except per share data)
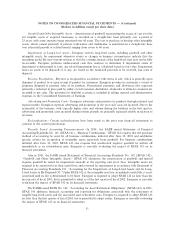
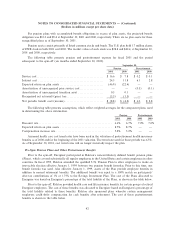
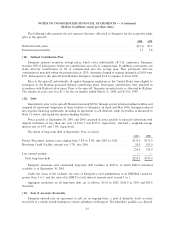
(7) Income Taxes
Prior to spin-oÅ, U.S. income tax payments, refunds, credits, provision and deferred tax components have
been allocated to Energizer in accordance with Ralston's tax allocation policy. Such policy allocates tax
components included in the consolidated income tax return of Ralston to Energizer to the extent such
components were generated by or related to Energizer. Subsequent to the spin-oÅ, taxes are provided on a
stand-alone basis.
Had the Energizer tax provision been calculated as if Energizer was a separate, independent U.S.
taxpayer, the income tax provision would have been higher by approximately $23.4 in 2000. The higher
provision is due primarily to the $24.4 of capital loss beneÑts that would not be realized on a stand-alone basis.
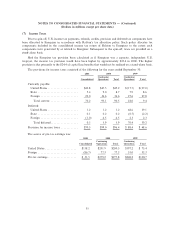
The provisions for income taxes consisted of the following for the years ended September 30:
2001 2000 1999
Continuing Continuing
Consolidated Operations Total Operations Total
Currently payable:
United States ÏÏÏÏÏÏÏÏÏÏÏÏÏÏÏÏÏÏÏÏÏ $42.8 $47.5 $45.2 $(17.5) $(27.0)
State ÏÏÏÏÏÏÏÏÏÏÏÏÏÏÏÏÏÏÏÏÏÏÏÏÏÏÏÏ 5.4 9.0 8.7 7.9 8.6
Foreign ÏÏÏÏÏÏÏÏÏÏÏÏÏÏÏÏÏÏÏÏÏÏÏÏÏÏ 22.0 36.6 36.6 27.6 27.8
Total current ÏÏÏÏÏÏÏÏÏÏÏÏÏÏÏÏÏÏÏ 70.2 93.1 90.5 18.0 9.4
Deferred:
United States ÏÏÏÏÏÏÏÏÏÏÏÏÏÏÏÏÏÏÏÏÏ 1.2 1.2 1.2 68.6 39.1
State ÏÏÏÏÏÏÏÏÏÏÏÏÏÏÏÏÏÏÏÏÏÏÏÏÏÏÏÏ 0.1 0.2 0.2 (0.5) (2.2)
Foreign ÏÏÏÏÏÏÏÏÏÏÏÏÏÏÏÏÏÏÏÏÏÏÏÏÏÏ (1.0) 4.5 4.5 2.3 2.3
Total deferredÏÏÏÏÏÏÏÏÏÏÏÏÏÏÏÏÏÏÏ 0.3 5.9 5.9 70.4 39.2
Provision for income taxes ÏÏÏÏÏÏÏÏÏÏÏÏ $70.5 $99.0 $96.4 $ 88.4 $ 48.6
The source of pre-tax earnings was:
2001 2000 1999
Continuing Continuing
Consolidated Operations Total Operations Total
United States ÏÏÏÏÏÏÏÏÏÏÏÏÏÏÏÏÏÏÏÏÏÏ $118.2 $201.9 $200.5 $197.2 $ 75.4
Foreign ÏÏÏÏÏÏÏÏÏÏÏÏÏÏÏÏÏÏÏÏÏÏÏÏÏÏÏ (86.7) 77.3 77.3 51.0 53.3
Pre-tax earnings ÏÏÏÏÏÏÏÏÏÏÏÏÏÏÏÏÏÏÏÏ $ 31.5 $279.2 $277.8 $248.2 $128.7
35