Energizer 2001 Annual Report Download - page 24
Download and view the complete annual report
Please find page 24 of the 2001 Energizer annual report below. You can navigate through the pages in the report by either clicking on the pages listed below, or by using the keyword search tool below to find specific information within the annual report.-
 1
1 -
2
-
3
-
4
-
5
-
6
-
7
-
8
-
9
-
10
-
11
-
12
-
13
-
 14
14 -
 15
15 -
 16
16 -
 17
17 -
 18
18 -
 19
19 -
 20
20 -
 21
21 -
 22
22 -
 23
23 -
 24
24 -
 25
25 -
 26
26 -
 27
27 -
 28
28 -
 29
29 -
 30
30 -
 31
31 -
 32
32 -
 33
33 -
 34
34 -
35
-
36
-
37
-
38
-
39
-
40
-
41
-
42
-
43
-
44
-
45
-
46
-
47
-
48
-
49
-
50
-
51
-
52
-
53
-
54
-
55
-
56
-
57
-
58
-
59
-
60
 |
 |

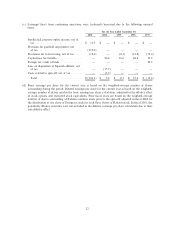
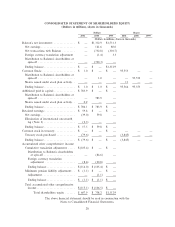
SUMMARY SELECTED HISTORICAL FINANCIAL INFORMATION
(Dollars in millions except per share data)
For the Year Ended September 30,
2001 2000 1999 1998 1997
Statement of Earnings Data
Net sales (a) ÏÏÏÏÏÏÏÏÏÏÏÏÏÏÏÏÏÏÏÏÏÏÏÏÏÏÏÏÏÏ $1,694.2 $1,927.7 $1,878.5 $1,930.7 $2,015.2
Depreciation and amortization ÏÏÏÏÏÏÏÏÏÏÏÏÏÏÏÏ 79.8 82.0 94.9 101.2 112.3
Earnings from continuing operations before
income taxes (b) ÏÏÏÏÏÏÏÏÏÏÏÏÏÏÏÏÏÏÏÏÏÏÏÏÏ 31.5 279.2 248.2 262.5 203.9
Income taxes ÏÏÏÏÏÏÏÏÏÏÏÏÏÏÏÏÏÏÏÏÏÏÏÏÏÏÏÏÏÏ 70.5 99.0 88.4 54.3 44.6
Earnings/(loss) from continuing operations (c) (39.0) 180.2 159.8 208.2 159.3
Net earnings/(loss) ÏÏÏÏÏÏÏÏÏÏÏÏÏÏÏÏÏÏÏÏÏÏÏÏÏ (39.0) 181.4 80.0 164.7 159.8
Earnings/(loss) per share from
continuing operations:
Basic ÏÏÏÏÏÏÏÏÏÏÏÏÏÏÏÏÏÏÏÏÏÏÏÏÏÏÏÏÏÏÏÏÏÏÏ $ (0.42) $ 1.88 $ 1.56 $ 2.05 $ 1.56
Diluted ÏÏÏÏÏÏÏÏÏÏÏÏÏÏÏÏÏÏÏÏÏÏÏÏÏÏÏÏÏÏÏÏÏ $ (0.42) $ 1.87 $ 1.56 $ 2.05 $ 1.56
Average shares outstanding (d)
Basic ÏÏÏÏÏÏÏÏÏÏÏÏÏÏÏÏÏÏÏÏÏÏÏÏÏÏÏÏÏÏÏÏÏÏÏ 92.6 96.1 102.6 101.6 102.1
Diluted ÏÏÏÏÏÏÏÏÏÏÏÏÏÏÏÏÏÏÏÏÏÏÏÏÏÏÏÏÏÏÏÏÏ 94.1 96.3 102.6 101.6 102.1
September 30,
2001 2000 1999 1998 1997
Balance Sheet Data
Working capital ÏÏÏÏÏÏÏÏÏÏÏÏÏÏÏÏÏÏÏÏÏÏÏÏÏÏÏÏ $ 288.1 $ 401.7 $ 478.1 $ 478.5 $ 489.6
Property at cost, netÏÏÏÏÏÏÏÏÏÏÏÏÏÏÏÏÏÏÏÏÏÏÏÏÏ 476.1 485.4 472.8 476.9 494.2
Additions (during the period) ÏÏÏÏÏÏÏÏÏÏÏÏÏÏ 77.9 72.8 69.2 102.8 98.8
Depreciation (during the period)ÏÏÏÏÏÏÏÏÏÏÏÏ 58.6 57.9 68.4 74.1 79.5
Total assets ÏÏÏÏÏÏÏÏÏÏÏÏÏÏÏÏÏÏÏÏÏÏÏÏÏÏÏÏÏÏÏÏ 1,497.6 1,793.5 1,833.7 2,077.6 2,113.6
Long-term debt ÏÏÏÏÏÏÏÏÏÏÏÏÏÏÏÏÏÏÏÏÏÏÏÏÏÏÏÏ 225.0 370.0 1.9 1.3 21.3
(a) Certain reclassiÑcations have been made to comply with EITF 00-10, 00-14 and 00-25. See Note 2 for
further information.
(b) Earnings/(loss) from continuing operations before income taxes were (reduced)/increased due to the
following unusual items:
For the Year Ended September 30,
2001 2000 1999 1998 1997
Intellectual property rights income ÏÏÏÏÏÏÏÏ $ 20.0 $ Ì $ Ì $ Ì $ Ì
Provision for goodwill impairment ÏÏÏÏÏÏÏÏÏ (119.0) ÌÌÌÌ
Provisions for restructuring ÏÏÏÏÏÏÏÏÏÏÏÏÏÏÏ (29.8) Ì (9.9) (21.3) (83.7)
Loss on disposition of Spanish aÇliate ÏÏÏÏÏ Ì (15.7) Ì Ì Ì
Costs related to spin-oÅ ÏÏÏÏÏÏÏÏÏÏÏÏÏÏÏÏÏ Ì (5.5) Ì Ì Ì
Total ÏÏÏÏÏÏÏÏÏÏÏÏÏÏÏÏÏÏÏÏÏÏÏÏÏÏÏÏÏÏÏ $ (128.8) $ (21.2) $ (9.9) $ (21.3) $ (83.7)
21