EasyJet 2012 Annual Report Download - page 7
Download and view the complete annual report
Please find page 7 of the 2012 EasyJet annual report below. You can navigate through the pages in the report by either clicking on the pages listed below, or by using the keyword search tool below to find specific information within the annual report.
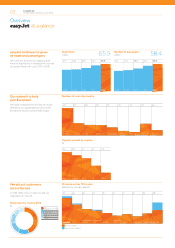
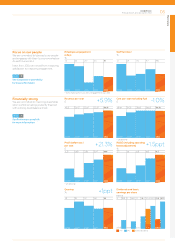
Employee engagement
(uSay)
%
72 66 23* 40 37
2008 2009 2010 2011 2012
Staff turnover
%
12 6.9 7.6 9.7 7.5
2008 2009 2010 2011 2012
Focus on our people
We are committed to listening to our people
and engaging with them to improve what we
do and how we do it.
Note, from 2010, we moved from measuring
satisfaction to measuring engagement.
32–37
See Corporate responsibility
for more information
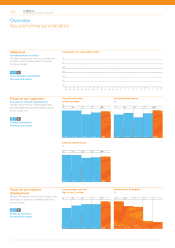
+5.9%
Revenue per seat
£
45.51 50.47 53.07 55.27 58.51
2008 2009 2010 2011 2012
-1.0%
Cost per seat excluding fuel
£
29.49 34.37 36.62 36.62 36.25
2008* 2009* 2010* 2011 2012
+21.3%
Profit before tax /
per seat
£
2.37 0.83 3.36 3.97 4.81
2008* 2009* 2010* 2011 2012
+1.5ppt
ROCE (including operating
leases adjustment)
%
5.7 3.6 6.9 9.8 11.3
2008 2009 2010 2011 2012
+1ppt
Gearing
%
29 38 32 28 29
2008 2009 2010 2011 2012
Dividends and basic
earnings per share
pence
0 0 0 45.4 21.5
2008 2009 2010 2011 2012
19.8 16.9 28.4 52.5 62.5
DPS EPS Special dividend
Financially strong
We are committed to improving shareholder
returns whilst remaining prudently financed
with a strong, liquid balance sheet.
* underlying
* underlying
19–30
See Performance and risk
for more information
* 2010: Satisfaction was 35%, engagement was 23%
Overview
easyJet plc
Annual report and accounts 2012 05


