EasyJet 2012 Annual Report Download - page 26
Download and view the complete annual report
Please find page 26 of the 2012 EasyJet annual report below. You can navigate through the pages in the report by either clicking on the pages listed below, or by using the keyword search tool below to find specific information within the annual report.-
 1
1 -
2
-
3
-
4
-
5
-
6
-
7
-
8
-
9
-
10
-
11
-
12
-
13
-
14
-
15
-
 16
16 -
 17
17 -
 18
18 -
 19
19 -
 20
20 -
 21
21 -
 22
22 -
 23
23 -
 24
24 -
 25
25 -
 26
26 -
 27
27 -
 28
28 -
 29
29 -
 30
30 -
 31
31 -
 32
32 -
 33
33 -
 34
34 -
 35
35 -
 36
36 -
37
-
38
-
39
-
40
-
41
-
42
-
43
-
44
-
45
-
46
-
47
-
48
-
49
-
50
-
51
-
52
-
53
-
54
-
55
-
56
-
57
-
58
-
59
-
60
-
61
-
62
-
63
-
64
-
65
-
66
-
67
-
68
-
69
-
70
-
71
-
72
-
73
-
74
-
75
-
76
-
77
-
78
-
79
-
80
-
81
-
82
-
83
-
84
-
85
-
86
-
87
-
88
-
89
-
90
-
91
-
92
-
93
-
94
-
95
-
96
-
97
-
98
-
99
-
100
-
101
-
102
-
103
-
104
-
105
-
106
-
107
-
108
 |
 |
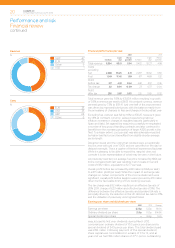
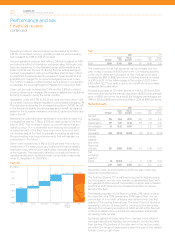
Operational measures
2012 2011 Change
Seats flown (millions) 65.9 62.5 5.5%
Passengers (millions) 58.4 54.5 7.1%
Load factor 88.7% 87.3% +1.4ppt
Available seat kilometres (ASK) (millions) 72,182 69,318 4.1%
Revenue passenger kilometres (RPK) (millions) 65,227 61,347 6.3%
Average sector length (kilometres) 1,096 1,110 (1.3%)
Sectors 411,008 393,147 4.5%
Block hours 786,854 761,708 3.3%
Number of aircraft owned / leased at end of year 214 204 4.9%
Average number of aircraft owned / leased during year 206.6 198.8 3.9%
Number of aircraft operated at end of year 203 197 3.0%
Average number of aircraft operated during year 195.7 185.4 5.5%
Operated aircraft utilisation (hours per day) 11.0 11.3 (2.1%)
Owned aircraft utilisation (hours per day) 10.4 10.5 (0.6%)
Number of routes operated at end of year 605 547 10.6%
Number of airports served at end of year 133 123 8.1%
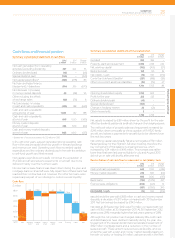
Financial measures
2012 2011 Change
Return on equity 14.6% 14.0% +0.6ppt
Return on capital employed – excluding operating leases adjustment 14.5% 12.7% +1.8ppt
Return on capital employed – including operating leases adjustment 11.3% 9.8% +1.5ppt
Gearing 29% 28% +1ppt
Profit before tax per seat (£) 4.81 3.97 21.3%
Profit before tax per ASK (pence) 0.44 0.36 22.8%
Revenue
Revenue per seat (£) 58.51 55.27 5.9%
Revenue per seat at constant currency (£) 59.41 55.27 7.5%
Revenue per ASK (pence) 5.34 4.98 7.2%
Revenue per ASK at constant currency (pence) 5.42 4.98 8.9%
Costs
Per seat measures
Total cost per seat (£) 53.70 51.30 4.7%
Total cost per seat excluding fuel (£) 36.25 36.62 (1.0%)
Total cost per seat excluding fuel at constant currency (£) 37.28 36.62 1.8%
Operational cost per seat (£) 50.45 47.78 5.6%
Operational cost per seat excluding fuel (£) 33.00 33.10 (0.3%)
Operational cost per seat excluding fuel at constant currency (£) 34.01 33.10 2.8%
Ownership cost per seat (£) 3.25 3.52 (7.8%)
Per ASK measures
Total cost per ASK (pence) 4.90 4.62 6.0%
Total cost per ASK excluding fuel (pence) 3.31 3.30 0.2%
Total cost per ASK excluding fuel at constant currency (pence) 3.40 3.30 3.1%
Operational cost per ASK (pence) 4.60 4.30 6.9%
Operational cost per ASK excluding fuel (pence) 3.01 2.98 0.6%
Operational cost per ASK excluding fuel at constant currency (pence) 3.10 2.98 4.1%
Ownership cost per ASK (pence) 0.30 0.32 (6.6%)
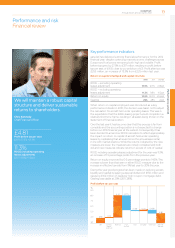
Performance and risk
Financial review
continued
easyJet plc
Annual report and accounts 2012
24