EasyJet 2012 Annual Report Download - page 24
Download and view the complete annual report
Please find page 24 of the 2012 EasyJet annual report below. You can navigate through the pages in the report by either clicking on the pages listed below, or by using the keyword search tool below to find specific information within the annual report.-
 1
1 -
2
-
3
-
4
-
5
-
6
-
7
-
8
-
9
-
10
-
11
-
12
-
13
-
 14
14 -
 15
15 -
 16
16 -
 17
17 -
 18
18 -
 19
19 -
 20
20 -
 21
21 -
 22
22 -
 23
23 -
 24
24 -
 25
25 -
 26
26 -
 27
27 -
 28
28 -
 29
29 -
 30
30 -
 31
31 -
 32
32 -
 33
33 -
 34
34 -
35
-
36
-
37
-
38
-
39
-
40
-
41
-
42
-
43
-
44
-
45
-
46
-
47
-
48
-
49
-
50
-
51
-
52
-
53
-
54
-
55
-
56
-
57
-
58
-
59
-
60
-
61
-
62
-
63
-
64
-
65
-
66
-
67
-
68
-
69
-
70
-
71
-
72
-
73
-
74
-
75
-
76
-
77
-
78
-
79
-
80
-
81
-
82
-
83
-
84
-
85
-
86
-
87
-
88
-
89
-
90
-
91
-
92
-
93
-
94
-
95
-
96
-
97
-
98
-
99
-
100
-
101
-
102
-
103
-
104
-
105
-
106
-
107
-
108
 |
 |
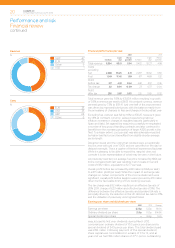
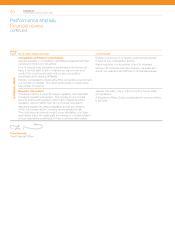
Fuel
2012 2011
£ million
£ per
seat
Pence
per ASK £ million
£ per
seat
Pence
per ASK
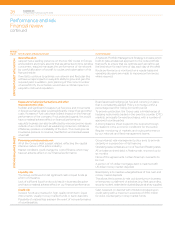
Fuel 1,149 17.45 1.59 917 14.68 1.32
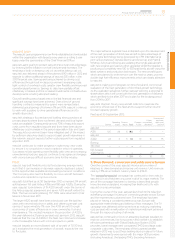
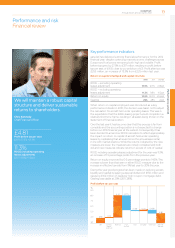
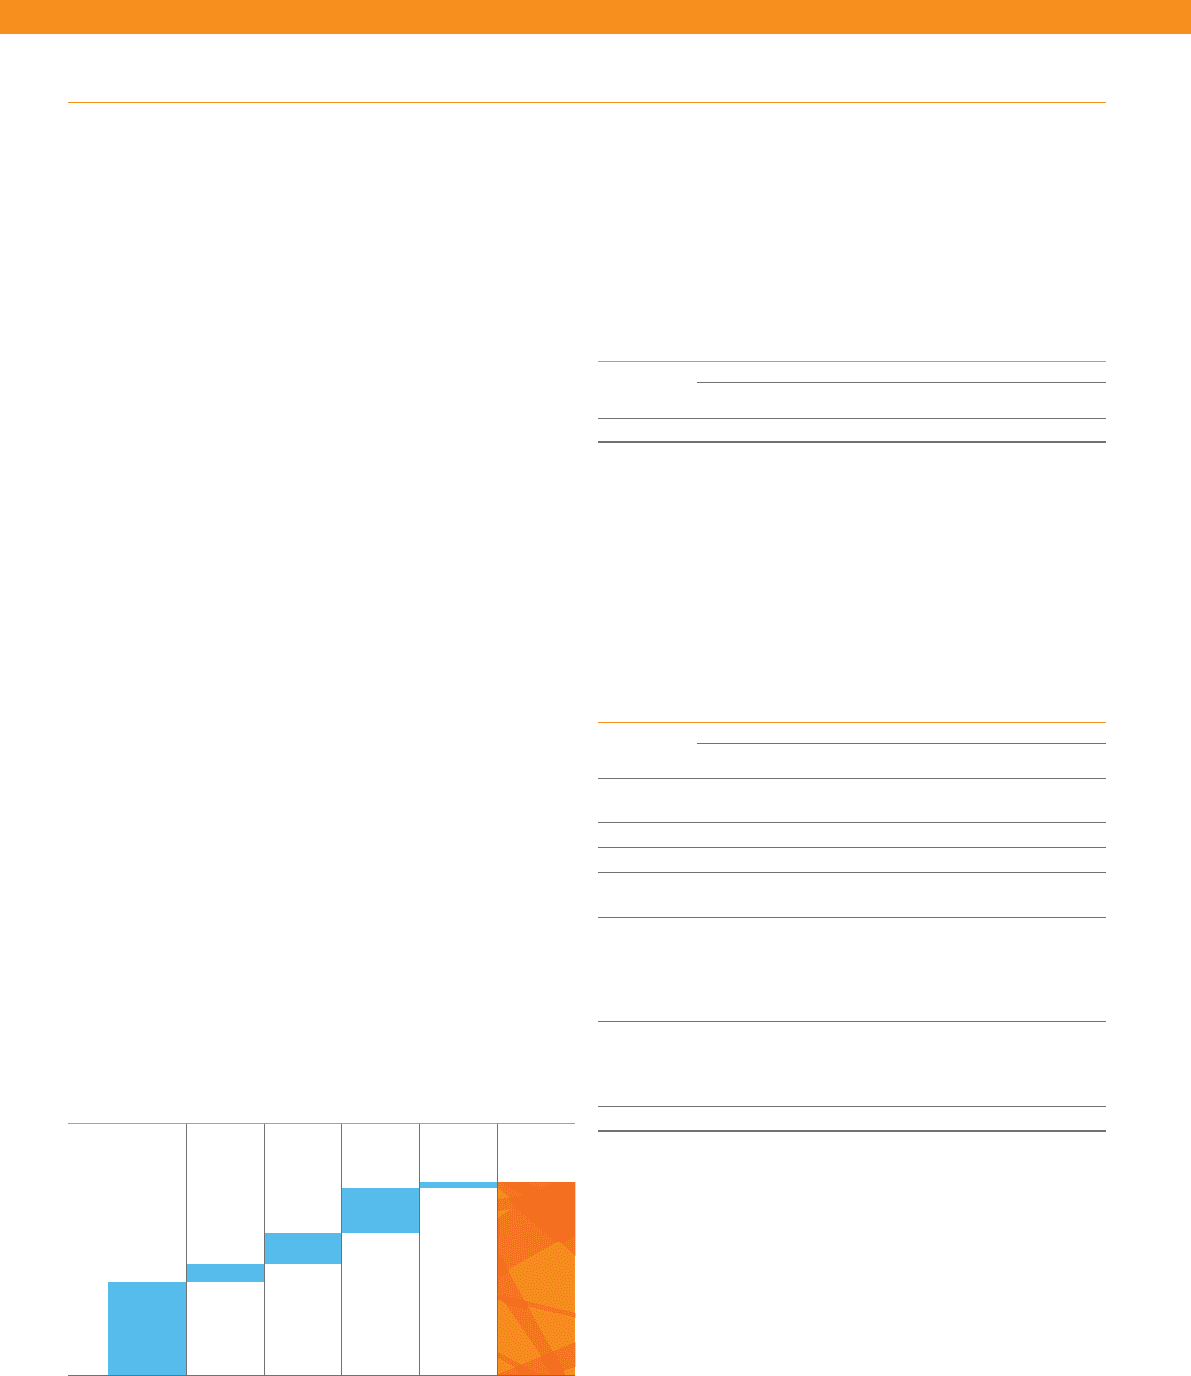
The market price for jet fuel remained high and volatile over the
year, mostly in excess of $1,000 per tonne. Our hedging activities
continued to defer the full impact of this. Average price paid
increased by $164 to $982 per tonne; in sterling terms an increase
of£110 to £618. Of the total increase in fuel costs of £232 million,
£182 million (£2.77 per seat) is due to the roll off of fuel purchases
hedged at favourable rates.
Forward purchases of 1.8 million tonnes of fuel for 2013 and 2014
were executed during the periodic dips below $1,000 at an average
price of $992 per tonne. As a result the hedged percentages are
78% for 2013 at $985 per tonne and 55% for 2014 at $993 per tonne.
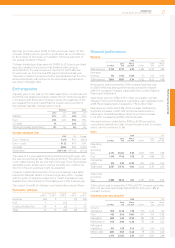
Ownership costs
2012 2011
£ million
£ per
seat
Pence
per ASK £ million
£ per
seat
Pence
per ASK
Aircraft
dryleasing 95 1.44 0.13 109 1.75 0.16
Depreciation 97 1.47 0.14 83 1.33 0.12
Amortisation 8 0.12 0.01 7 0.12 0.01
Interest
receivable (10) (0.14) (0.01) (9) (0.15) (0.01)
Interest
payable
andother
financing
charges 25 0.38 0.03 24 0.38 0.03
Net
exchange
(gains) /
losses (1) (0.02) – 6 0.09 0.01
214 3.25 0.30 220 3.52 0.32
Ownership costs declined slightly to £3.25 per seat; continuing
recent strong performance.
The final two Boeing 737 aircraft were returned to lessors during
thefirst quarter, and we now operate a standardised fleet with
twogauges of Airbus aircraft. Depreciation cost per seat increased
by £0.14 to £1.47 driven by the increased proportion of owned
aircraft in the fleet.
The leased proportion of the fleet is currently 26%, which is below
the objective of a 70% owned and 30% leased fleet mix, as
completion of a number of leases was deferred into the first
quarterof the coming financial year. The recent trend of declining
ownership costs is not expected to continue at the same rate,
although the increasing proportion of A320 aircraft in the fleet will
continue to deliver some reductions to depreciation and aircraft
dryleasing costs per seat.
Exchange gains and losses arise from changes in the value of
monetary assets and liabilities denominated in currencies other
than sterling. Fluctuations of the size seen in the last two years
are within the range of expectations given the size of the related
foreign currency cash flows.
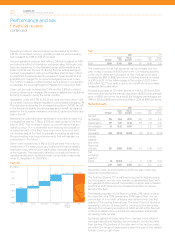
Operating costs per seat excluding fuel decreased by 0.3% to
£33.00. At constant currency, operating costs per seat excluding
fuel increased by 2.8% to £34.01 per seat.
Ground operations cost per seat fell by 2.0% but increased by 1.6%
excluding the effect of changes in exchange rates. Although costs
have decreased due to the relatively benign winter weather and
better controls over the use of de-icing fluid, as well as savings on
contract renegotiations with ground handlers, this has been offset
by significant increase at airports operated in Spain by AENA and
adoubling of charges for on-ground navigation services in Italy.
Thefurther increases in AENA charges were a factor in our decision
to withdraw the six aircraft based in Madrid from December 2012.
Crew cost per seat increased by 0.6%, and by 2.8% at constant
currency driven by an average 2% increase in salaries and disciplined
thinning of capacity during the winter months.
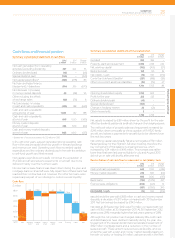
Navigation costs fell 6.7% to £4.25 per seat and were down 1.2%
atconstant currency despite regulated cost increases averaging 2%.
This reduction is driven by the increased proportion of A320 aircraft
in the fleet and a slightly shorter average sector length as capacity
based on the European mainland continues to grow at a faster rate
than in the UK.
Maintenance costs have been declining for a number of years, but
increased this year by 7.7% to £3.08 per seat; similar to the level
seen in 2010. This increase is driven by one-off items that are
unlikelyto recur. The cost benefits from reducing the proportion
ofleased aircraft in the fleet have now come to an end, and
theaverage age of the fleet is gradually increasing as planned.
Weare investing in process improvements that will maintain our
costposition in the future.
Other costs increased by 11.3% to £3.05 per seat. This is due to
investment in IT infrastructure, and higher performance-related
employee costs, reflecting the significantly improved profitability
ofthe business. This was partly offset by unusually low levels of
operational disruption resulting in lower compensation payments
under EU Regulation EU261/2004.
Fuel cost
£ million
900
700
1,200
1,000
800
1,100
1,149
2011 2012Volume Market price Jet hedging Foreign
exchange
hedging
917
42
73
104 13
Performance and risk
Financial review
continued
easyJet plc
Annual report and accounts 2012
22