EasyJet 2012 Annual Report Download - page 22
Download and view the complete annual report
Please find page 22 of the 2012 EasyJet annual report below. You can navigate through the pages in the report by either clicking on the pages listed below, or by using the keyword search tool below to find specific information within the annual report.-
 1
1 -
2
-
3
-
4
-
5
-
6
-
7
-
8
-
9
-
10
-
11
-
 12
12 -
 13
13 -
 14
14 -
 15
15 -
 16
16 -
 17
17 -
 18
18 -
 19
19 -
 20
20 -
 21
21 -
 22
22 -
 23
23 -
 24
24 -
 25
25 -
 26
26 -
 27
27 -
 28
28 -
 29
29 -
 30
30 -
 31
31 -
 32
32 -
33
-
34
-
35
-
36
-
37
-
38
-
39
-
40
-
41
-
42
-
43
-
44
-
45
-
46
-
47
-
48
-
49
-
50
-
51
-
52
-
53
-
54
-
55
-
56
-
57
-
58
-
59
-
60
-
61
-
62
-
63
-
64
-
65
-
66
-
67
-
68
-
69
-
70
-
71
-
72
-
73
-
74
-
75
-
76
-
77
-
78
-
79
-
80
-
81
-
82
-
83
-
84
-
85
-
86
-
87
-
88
-
89
-
90
-
91
-
92
-
93
-
94
-
95
-
96
-
97
-
98
-
99
-
100
-
101
-
102
-
103
-
104
-
105
-
106
-
107
-
108
 |
 |
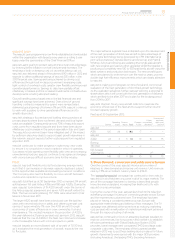
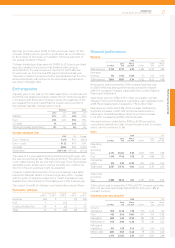
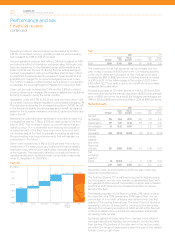
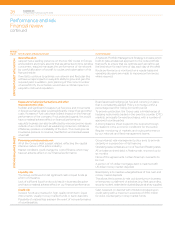
Financial performance per seat
2012 2011
£ million
£ per
seat
Pence
per ASK £ million
£ per
seat
Pence
per ASK
Total revenue 3,854 58.51 5.34 3,452 55.27 4.98
Costs
excluding
fuel 2,388 36.25 3.31 2,287 36.62 3.30
Fuel 1,149 17.45 1.59 917 14.68 1.32
Profit
beforetax 317 4.81 0.44 248 3.97 0.36
Tax charge 62 0.94 0.09 23 0.37 0.04
Profit
after tax 255 3.87 0.35 225 3.60 0.32
Total revenue grew by 11.6% to £3,854 million resulting in growth
of 5.9% in revenue per seat to £58.51. At constant currency, revenue
per seat grew by 7.5% to £59.41. Just over half of this improvement
was driven by improved ticket prices, with the balance mainly from
the annualising of changes to fees and charges introduced last year.
Excluding fuel, cost per seat fell by 1.0% to £36.25, however it grew
by 1.8% at constant currency. easyJet experienced above-
inflation increases in charges at regulated airports (particularly in
Spain and Italy). Set against this easyJet successfully re-negotiated
a number of key ground handling contracts and also continued to
benefit from the increasing proportion of larger A320 aircraft in the
fleet. To a lesser extent, cost per seat was also adversely impacted
by higher load factors and benefited from slightly shorter average
sector length.
Disruption levels and the costs that resulted were exceptionally
low this year with just over 1,000 sectors cancelled on the day or
delayed overnight. This is a quarter of the level experienced last year.
While it is pleasing to be able to report this, easyJet does not
consider it to be representative of what may be seen inthe future.
As previously reported, our average fuel price increased by $164 per
tonne compared with last year resulting in an increase in fuel unit
costs of £182 million, equivalent to £2.77 per seat.
Overall, profit before tax increased by £69 million (£0.84 per seat)
to£317 million (£4.81 per seat). While the impact of exchange rate
changes on certain components of the income statement were
significant, overall profit before taxation was improved by £10 million
driven by the favourable timing of Euro booking revenues.
The tax charge was £62 million resulting in an effective tax rate of
20% (2011: charge of £23 million and effective tax rate of 9%). The
difference between the effective tax rate and standard UK rate is
principally driven by the reduction in the UK deferred tax rate to 23%
and the utilisation of previously unrecognised losses.
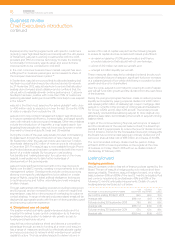
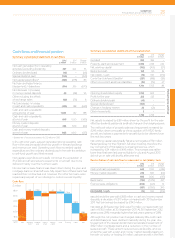
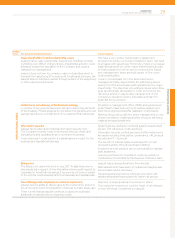
Earnings per share and dividends per share
2012 2011 Change
Earnings per share 62.5p 52.5p 19.0%
Ordinary dividend per share 21.5p 10.5p 104.8%
Special dividend per share –34.9p N/A
easyJet paid its first ever dividends during March 2012,
comprising an ordinary dividend of 10.5 pence per share and a
special dividend of 34.9 pence per share. The total dividend paid
was £196 million. Following payment of the special dividend,
share capital was consolidated on a basis of 11 for 12, and at
year end wehad 396 million shares of 272/7 pence outstanding.
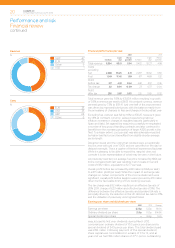
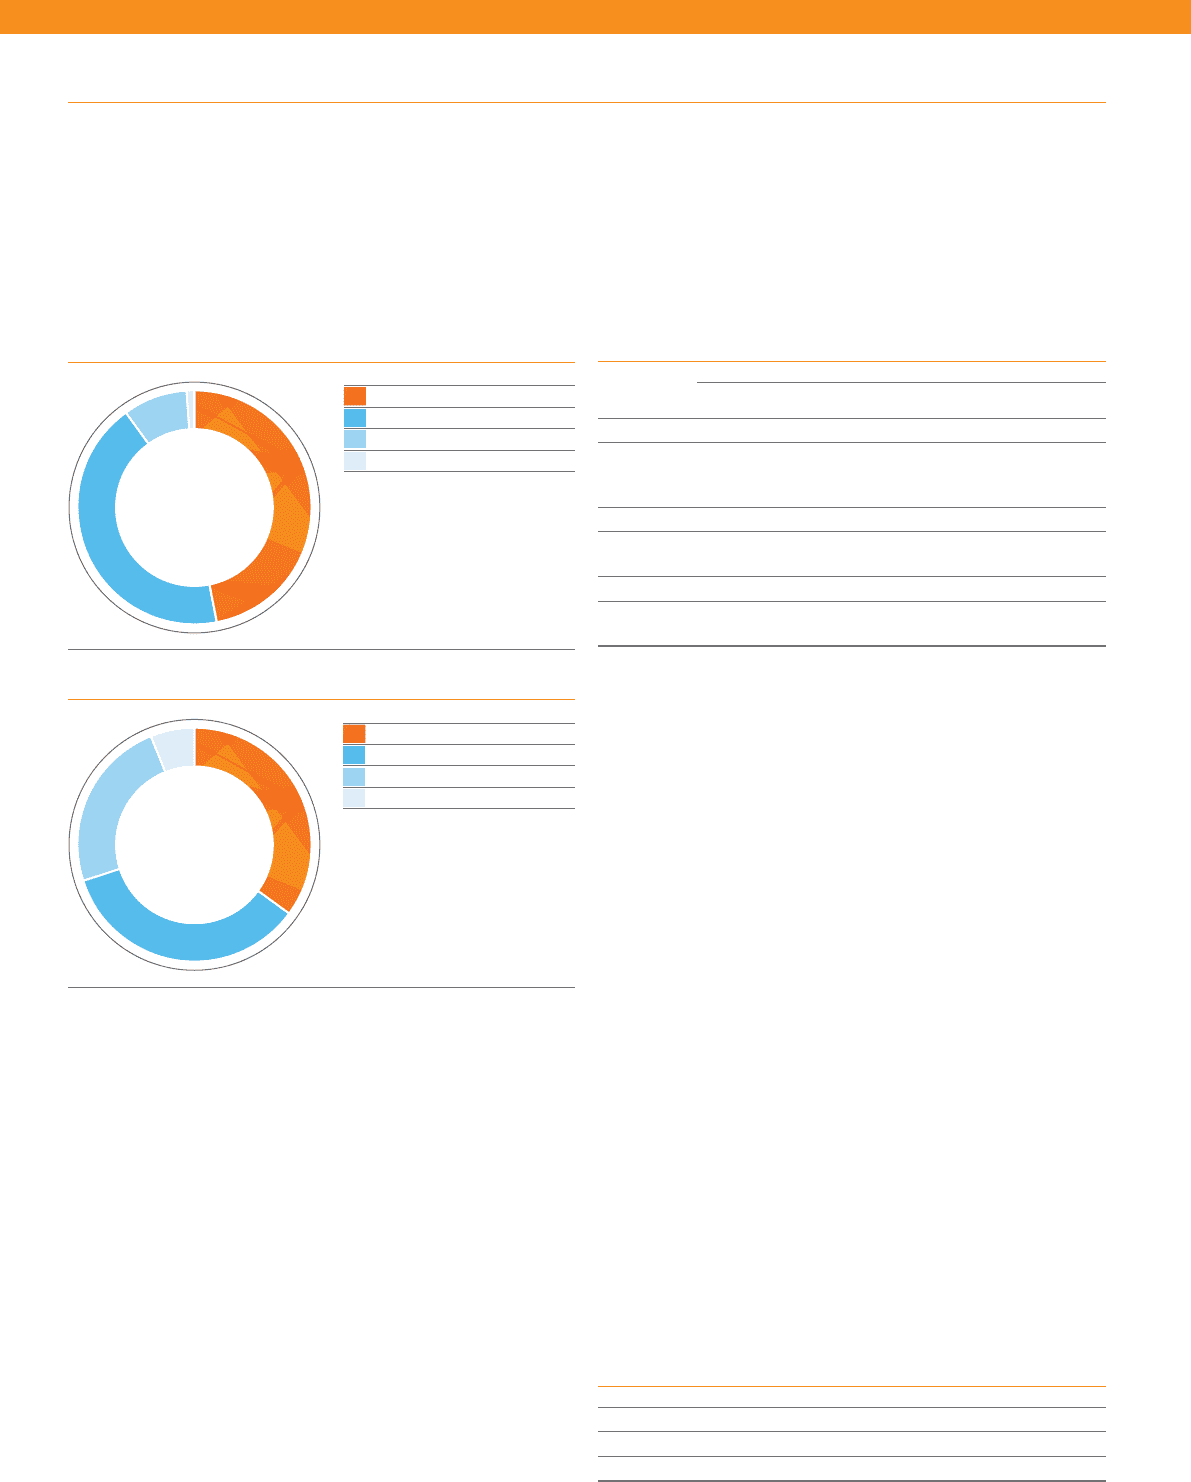
Revenue
%
GBP
EUR
Other
USD
47
43
1
9
Costs
%
EUR
USD
GBP
Other
35
35
6
24
Performance and risk
Financial review
continued
easyJet plc
Annual report and accounts 2012
20