EasyJet 2012 Annual Report Download - page 21
Download and view the complete annual report
Please find page 21 of the 2012 EasyJet annual report below. You can navigate through the pages in the report by either clicking on the pages listed below, or by using the keyword search tool below to find specific information within the annual report.-
 1
1 -
2
-
3
-
4
-
5
-
6
-
7
-
8
-
9
-
10
-
 11
11 -
 12
12 -
 13
13 -
 14
14 -
 15
15 -
 16
16 -
 17
17 -
 18
18 -
 19
19 -
 20
20 -
 21
21 -
 22
22 -
 23
23 -
 24
24 -
 25
25 -
 26
26 -
 27
27 -
 28
28 -
 29
29 -
 30
30 -
 31
31 -
32
-
33
-
34
-
35
-
36
-
37
-
38
-
39
-
40
-
41
-
42
-
43
-
44
-
45
-
46
-
47
-
48
-
49
-
50
-
51
-
52
-
53
-
54
-
55
-
56
-
57
-
58
-
59
-
60
-
61
-
62
-
63
-
64
-
65
-
66
-
67
-
68
-
69
-
70
-
71
-
72
-
73
-
74
-
75
-
76
-
77
-
78
-
79
-
80
-
81
-
82
-
83
-
84
-
85
-
86
-
87
-
88
-
89
-
90
-
91
-
92
-
93
-
94
-
95
-
96
-
97
-
98
-
99
-
100
-
101
-
102
-
103
-
104
-
105
-
106
-
107
-
108
 |
 |

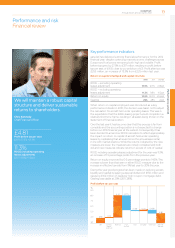
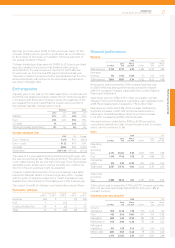
Key performance indicators
easyJet has delivered a strong financial performance for the 2012
financial year, despite continuing macroeconomic challenges across
Europe and fuel prices remaining both high and volatile. Profit
before tax grew by 27.9% to £317 million, resulting in profit before
tax per seat of £4.81; close to our ambition of £5. Profit after tax was
£255 million, an increase of 13.3% from £225 million last year.
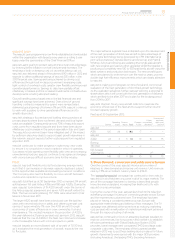
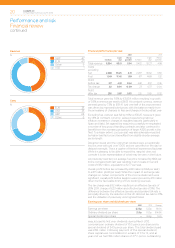
Return on capital employed and capital structure
2012 2011 Change
ROCE – excluding operating
leasesadjustment 14.5% 12.7% +1.8ppt
ROCE – including operating
leasesadjustment 11.3% 9.8% +1.5ppt
Return on equity 14.6% 14.0% +0.6ppt
Gearing 29% 28% +1ppt
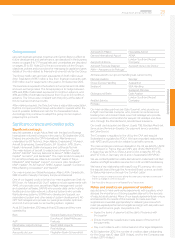
When return on capital employed was introduced as a key
performance indicator in 2010, the decision was taken not to adjust
the calculation for aircraft held under operating leases. This was in
the expectation that the IASB’s leasing project would complete in a
relatively short time frame, resulting in all leases being shown on the
statement of financial position.
Over the last year it has become clear that this process is far from
complete and the accounting position is not expected to change
before our 2016 financial year at the earliest. Consequently it has
been decided to amend our ROCE calculation to reflect appropriately
the impact on return on capital of aircraft held under operating
leases by capitalising that at seven times the annual lease rental,
inline with market practice. While the returns indicated by the new
measure are lower, the measures are closely correlated and both
oldand new measures indicate returns in excess of cost of capital.
ROCE including operating leases adjustment for the year was 11.3%,
an increase of 1.5 percentage points from the previous year.
Return on equity improved by 0.6 percentage points to 14.6%. This
increase is lower than that seen in either ROCE measure due to the
increase in effective tax rate from 9% last year to 20% this year.
During the year good progress has been made on reducing excess
liquidity and capital by paying a special dividend of £150 million and
repaying £162 million of relatively high-coupon mortgage debt.
Gearing was stable at 29% (2011: 28%).
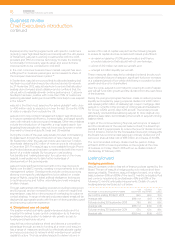
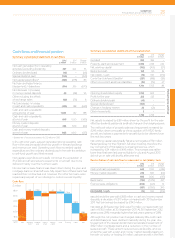
Profit before tax per seat
%
6.0
3.0 2012
9.0
7.0
5.0
4.0
8.0
4.81
2011 Currency
impact
(excl fuel)
Revenue Fuel
(inc fuel)
Crew Disruption Other cost 2012 PBT
per seat
3.97 0.12
4.14 (2.77)
(0.18) (0.69)
0.22
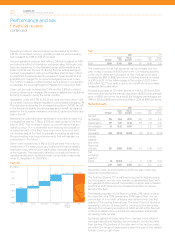
Performance and risk
Financial review
Performance and risk
easyJet plc
Annual report and accounts 2012 19
We will maintain a robust capital
structure and deliver sustainable
returns to shareholders.
Chris Kennedy
Chief Financial Officer
£4.81
Profit before tax per seat
(2011: £3.97) +21.3%
11.3%
ROCE (including operating
leases adjustment)
(2011: 9.8%) +1.5ppt