EasyJet 2012 Annual Report Download - page 105
Download and view the complete annual report
Please find page 105 of the 2012 EasyJet annual report below. You can navigate through the pages in the report by either clicking on the pages listed below, or by using the keyword search tool below to find specific information within the annual report.-
 1
1 -
2
-
3
-
4
-
5
-
6
-
7
-
8
-
9
-
10
-
11
-
12
-
13
-
14
-
15
-
16
-
17
-
18
-
19
-
20
-
21
-
22
-
23
-
24
-
25
-
26
-
27
-
28
-
29
-
30
-
31
-
32
-
33
-
34
-
35
-
36
-
37
-
38
-
39
-
40
-
41
-
42
-
43
-
44
-
45
-
46
-
47
-
48
-
49
-
50
-
51
-
52
-
53
-
54
-
55
-
56
-
57
-
58
-
59
-
60
-
61
-
62
-
63
-
64
-
65
-
66
-
67
-
68
-
69
-
70
-
71
-
72
-
73
-
74
-
75
-
76
-
77
-
78
-
79
-
80
-
81
-
82
-
83
-
84
-
85
-
86
-
87
-
88
-
89
-
90
-
91
-
92
-
93
-
94
-
 95
95 -
 96
96 -
 97
97 -
 98
98 -
 99
99 -
 100
100 -
 101
101 -
 102
102 -
 103
103 -
 104
104 -
 105
105 -
 106
106 -
 107
107 -
 108
108
 |
 |

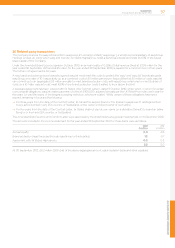
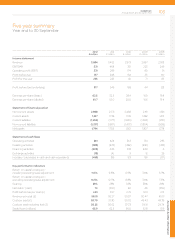
Five year summary
Year end to 30 September
2012
£ million
2011
£ million
2010
£ million
2009
£ million
2008
£ million
Income statement
Revenue 3,854 3,452 2,973 2,667 2,363
EBITDAR 531 468 361 225 249
Operating profit (EBIT) 331 269 174 60 91
Profit before tax 317 248 154 55 110
Profit for the year 255 225 121 71 83
Profit before tax (underlying) 317 248 188 44 123
Earnings per share (basic) 62.5 52.5 28.4 16.9 19.8
Earnings per share (diluted) 61.7 52.0 28.0 16.6 19.4
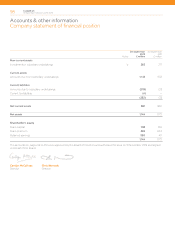
Statement of financial position
Non-current assets 2,968 2,731 2,488 2,191 1,681
Current assets 1,327 1,738 1,515 1,482 1,415
Current liabilities (1,264) (1,177) (1,065) (1,062) (910)
Non-current liabilities (1,237) (1,587) (1,437) (1,304) (908)
Net assets 1,794 1,705 1,501 1,307 1,278
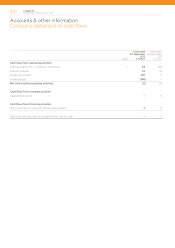
Statement of cash flows
Operating activities 261 424 363 134 296
Investing activities (389) (478) (482) (430) (418)
Financing activities (309) 246 233 440 6
Exchange activities (18) (4) 9 12 29
Increase / (decrease) in cash and cash equivalents (455) 188 123 156 (87)
Key performance indicators
Return on capital employed –
including operating lease adjustment 11.3% 9.8% 6.9% 3.6% 5.7%
Return on capital employed –
excluding operating lease adjustment 14.5% 12.7% 8.8% 3.6% 7.3%
Gearing 29% 28% 32% 38% 29%
Net debt / (cash) 74 (100) 40 46 (236)
Profit before tax per seat (£) 4.81 3.97 2.75 1.04 2.12
Revenue per seat (£) 58.51 55.27 53.07 50.47 45.51
Cost per seat (£) 53.70 51.30 50.32 49.43 43.39
Cost per seat excluding fuel (£) 36.25 36.62 37.23 34.16 29.74
Seats flown (millions) 65.9 62.5 56.0 52.8 51.9
Accounts & other information
easyJet plc
Annual report and accounts 2012 103