EasyJet 2012 Annual Report Download - page 54
Download and view the complete annual report
Please find page 54 of the 2012 EasyJet annual report below. You can navigate through the pages in the report by either clicking on the pages listed below, or by using the keyword search tool below to find specific information within the annual report.-
 1
1 -
2
-
3
-
4
-
5
-
6
-
7
-
8
-
9
-
10
-
11
-
12
-
13
-
14
-
15
-
16
-
17
-
18
-
19
-
20
-
21
-
22
-
23
-
24
-
25
-
26
-
27
-
28
-
29
-
30
-
31
-
32
-
33
-
34
-
35
-
36
-
37
-
38
-
39
-
40
-
41
-
42
-
43
-
 44
44 -
 45
45 -
 46
46 -
 47
47 -
 48
48 -
 49
49 -
 50
50 -
 51
51 -
 52
52 -
 53
53 -
 54
54 -
 55
55 -
 56
56 -
 57
57 -
 58
58 -
 59
59 -
 60
60 -
 61
61 -
 62
62 -
 63
63 -
 64
64 -
65
-
66
-
67
-
68
-
69
-
70
-
71
-
72
-
73
-
74
-
75
-
76
-
77
-
78
-
79
-
80
-
81
-
82
-
83
-
84
-
85
-
86
-
87
-
88
-
89
-
90
-
91
-
92
-
93
-
94
-
95
-
96
-
97
-
98
-
99
-
100
-
101
-
102
-
103
-
104
-
105
-
106
-
107
-
108
 |
 |
Governance
Directors’ remuneration report
continued
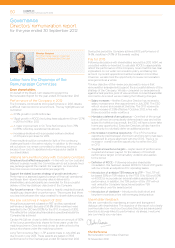
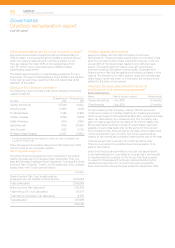
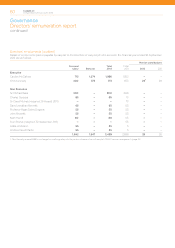
How was pay linked to performance in 2012?
Annual bonus
For 2012, the annual bonus was based on the following
performance targets:
Measure
As a percentage of maximum
bonus opportunity
CEO CFO
Profit before tax 70% 60%
On-time performance 10% 10%
Customer satisfaction targets 10% 10%
Total cost per seat excluding fuel
at constant currency 10% 10%
Departmental objectives – 10%
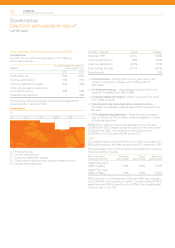
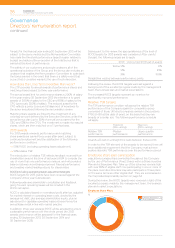
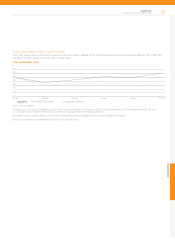
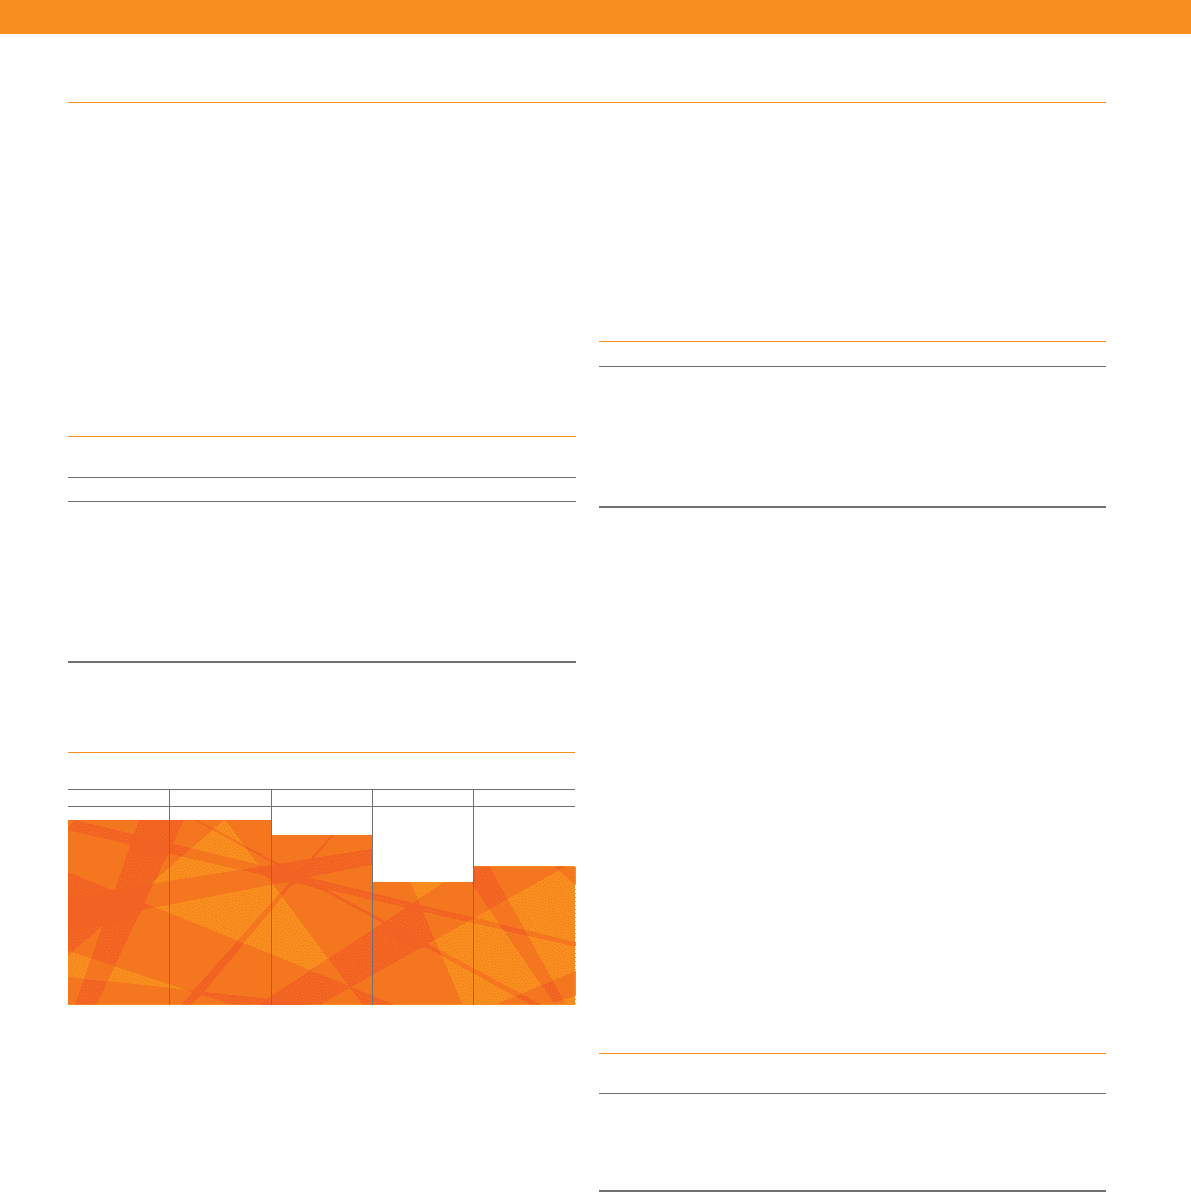
The following chart shows performance achieved against the
bonus targets in respect of 2012:
A – Profit before tax
B – On-time performance
C – Customer satisfaction targets
D – Total cost per seat excluding fuel at constant currency
E – Departmental objectives
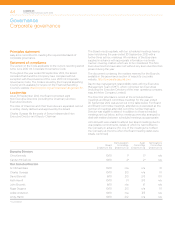
Company measures Actual Achieved
Financial – PBT £317m 100%
On-time performance 88% 100%
Customer satisfaction 82.5% 91.7%
Cost per seat (ex fuel) £37.57 66.3%
Departmental 75%
→Profit before tax – Strong performance, particularly in the
context of fuel price increases, with 27.9% growth to
£317 million.
→On-time performance – Very pleasing improvement in this
measure, increasing from 79% to 88%.
→Customer satisfaction targets – Much improved score, rising
from 78.6% to 82.5%.
→Total cost per seat excluding fuel at constant currency –
We made considerable progress against this measure during
the year.
→CFO’s departmental objectives – Reflects a very successful
year for Finance & Procurement, measured against a number
of business objectives.
95.8% of the maximum bonus was awarded to the CEO and
93.3% for the CFO in respect of performance for the year ended
30 September 2012. This resulted in a bonus payment of
£1,274,101 to the CEO and £373,188 to the CFO.
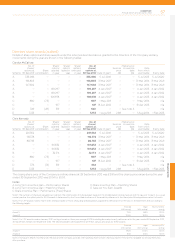
LTIP
The awards made to Executive Directors in 2010 were subject to
ROE performance in the financial year ended 30 September 2012.
The percentage which could be earned was determined using the
following vesting schedule:
ROE year ended
30 September 2012
Threshold
(25% vests)
Target
(50% vests)
Maximum
(100% vests)
Award One (up to
100% of salary) 9.0% 12.0% 15.0%
Award Two (over
100% of salary) 11.0% 13.0% 15.0%
ROE in the year to 30 September 2012 was 14.6%, this compares
to a 5.5% ROE in the year prior to grant. Correspondingly 93.3% of
award one and 90% of award two (or 91.7% of the overall award)
is due to vest in July 2013.
easyJet plc
Annual report and accounts 2012
52
Achievement
%
100 100 91.7 66.3 75
ABCDE