EasyJet 2012 Annual Report Download - page 23
Download and view the complete annual report
Please find page 23 of the 2012 EasyJet annual report below. You can navigate through the pages in the report by either clicking on the pages listed below, or by using the keyword search tool below to find specific information within the annual report.-
 1
1 -
2
-
3
-
4
-
5
-
6
-
7
-
8
-
9
-
10
-
11
-
12
-
 13
13 -
 14
14 -
 15
15 -
 16
16 -
 17
17 -
 18
18 -
 19
19 -
 20
20 -
 21
21 -
 22
22 -
 23
23 -
 24
24 -
 25
25 -
 26
26 -
 27
27 -
 28
28 -
 29
29 -
 30
30 -
 31
31 -
 32
32 -
 33
33 -
34
-
35
-
36
-
37
-
38
-
39
-
40
-
41
-
42
-
43
-
44
-
45
-
46
-
47
-
48
-
49
-
50
-
51
-
52
-
53
-
54
-
55
-
56
-
57
-
58
-
59
-
60
-
61
-
62
-
63
-
64
-
65
-
66
-
67
-
68
-
69
-
70
-
71
-
72
-
73
-
74
-
75
-
76
-
77
-
78
-
79
-
80
-
81
-
82
-
83
-
84
-
85
-
86
-
87
-
88
-
89
-
90
-
91
-
92
-
93
-
94
-
95
-
96
-
97
-
98
-
99
-
100
-
101
-
102
-
103
-
104
-
105
-
106
-
107
-
108
 |
 |
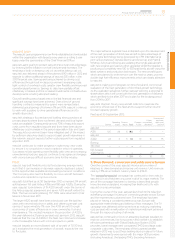
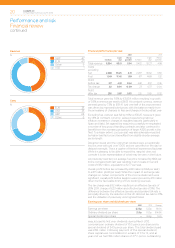
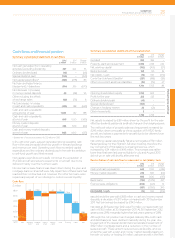
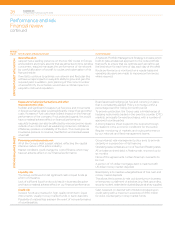
Financial performance
Revenue
2012 2011
£ million
£ per
seat
Pence
per ASK £ million
£ per
seat
Pence
per ASK
Seat revenue 3,794 57.61 5.26 3,389 54.25 4.89
Non-seat
revenue 60 0.90 0.08 63 1.02 0.09
Total revenue 3,854 58.51 5.34 3,452 55.27 4.98
Revenue per seat improved by 5.9% compared with last year
to£58.51 reflecting strong performances across the network
(withthe exception of Spain), particularly from London Gatwick,
France and Switzerland.
Seats flown grew by 5.5% to 65.9 million, principally in London
Gatwick, France and Switzerland. Load factor was marginally higher
at 88.7% and passengers increased by 7.1% to 58.4 million.
Seat revenue contributed 6.2% of this increase, held back by
significant increases in APD, VAT and similar taxes levied on
passengers. Overall these taxes, driven by a further increase
inUKAPD, increased by 8.0% to £6.76 per seat.
Non-seat revenue contracted by 11.8% to £0.90 per seat as
commissions earned from sale of travel insurance and, to a lesser
extent, car hire continued to fall.
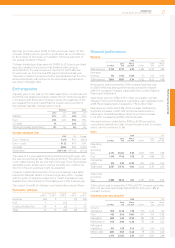
Costs
2012 2011
£ million
£ per
seat
Pence
per ASK £ million
£ per
seat
Pence
per ASK
Operating
costs
excluding
fuel 2,174 33.00 3.01 2,067 33.10 2.98
Fuel 1,149 17.45 1.59 917 14.68 1.32
Ownership
costs 214 3.25 0.30 220 3.52 0.32
Total costs 3,537 53.70 4.90 3,204 51.30 4.62
Total costs
excluding
fuel 2,388 36.25 3.31 2,287 36.62 3.30
Total cost per seat increased by 4.7% to £53.70; however excluding
fuel, cost per seat was broadly flat at £36.25, and up by 1.8% at
constant currency.
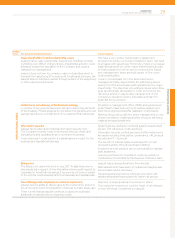
Operating costs excluding fuel
2012 2011
£ million
£ per
seat
Pence
per ASK £ million
£ per
seat
Pence
per ASK
Ground
operations 955 14.49 1.32 923 14.79 1.33
Crew 432 6.55 0.60 407 6.51 0.58
Navigation 280 4.25 0.39 285 4.56 0.41
Maintenance 203 3.08 0.28 179 2.86 0.26
Selling and
marketing 104 1.58 0.14 102 1.64 0.15
Other costs 200 3.05 0.28 171 2.74 0.25
2,174 33.00 3.01 2,067 33.10 2.98
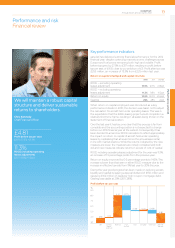
Earnings per share grew 19.0% to 62.5 pence per share. Of this
increase, 13.6% is due to growth in profit after tax and 5.4% due
to the impact of the share consolidation following payment of
the special dividend in March.
Ordinary dividend per share grew by 104.8% to 21.5 pence per share.
easyJet is pleased to announce that dividend policy is being
amended from this year to pay out one-third of profit after tax
foreach year, up from the one-fifth payout introduced last year.
There are no plans to propose a further special dividend at this time,
and excess liquidity will continue to be used where appropriate to
pay down mortgage debt.
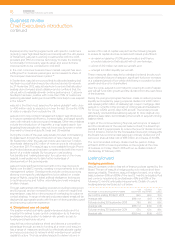
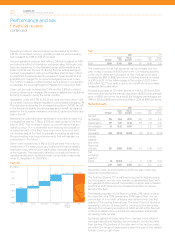
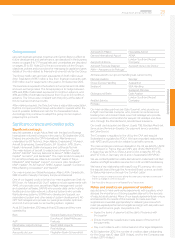
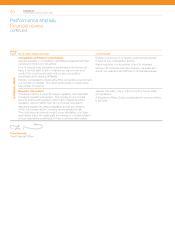
Exchange rates
Capacity grew in the year by 3.4 million seats flown, of which around
two-thirds was deployed in bases outside the UK. While thisresulted
in increased cash flows denominated in euros, the weakness of the
euro against the pound meant that the overall currency profile of
the business was little changed year-on-year:
Revenue Costs
2012 2011 2012 2011
Sterling 47% 47% 24% 24%
Euro 43% 44% 35% 35%
US dollar 1% –35% 35%
Other (principally Swiss franc) 9% 9% 6% 6%
Average exchange rates
2012 2011 Change
Euro – revenue €1.19 €1.15 (3.9%)
Euro – costs €1.22 €1.15 5.8%
US dollar $1.60 $1.61 (0.6%)
Swiss franc CHF 1.46 CHF 1.45 (0.7%)
The value of the euro against sterling declined during the year, with
the year end exchange rate 7.8% lower at €1.25/£1. This decline was
more marked during the second half of the year. Since the business
generates a euro surplus (euro revenue exceeds euro costs) a net
loss from this euro exposure might be expected.
However a significant proportion of summer bookings were taken
before the sharpest decline in the exchange rate, which, coupled
with the policy of hedging surplus euros, meant that easyJet was
shielded from the full impact of the falling euro in this financial year.
The impact on profit of changes in exchange rates was as follows:
Favourable / (adverse)
Euro
£ million
Swiss franc
£ million
US dollar
£ million
Other
£ million
Total
£ million
Revenue (65) 9 1 (5) (60)
Fuel 11 – (10) – 1
Costs excluding fuel 68 4 (5) 2 69
Total 14 13 (14) (3) 10
Performance and risk
easyJet plc
Annual report and accounts 2012 21