Dish Network 2005 Annual Report Download - page 60
Download and view the complete annual report
Please find page 60 of the 2005 Dish Network annual report below. You can navigate through the pages in the report by either clicking on the pages listed below, or by using the keyword search tool below to find specific information within the annual report.-
 1
1 -
2
-
3
-
4
-
5
-
6
-
7
-
8
-
9
-
10
-
11
-
12
-
13
-
14
-
15
-
16
-
17
-
18
-
19
-
20
-
21
-
22
-
23
-
24
-
25
-
26
-
27
-
28
-
29
-
30
-
31
-
32
-
33
-
34
-
35
-
36
-
37
-
38
-
39
-
40
-
41
-
42
-
43
-
44
-
45
-
46
-
47
-
48
-
49
-
 50
50 -
 51
51 -
 52
52 -
 53
53 -
 54
54 -
 55
55 -
 56
56 -
 57
57 -
 58
58 -
 59
59 -
 60
60 -
 61
61 -
 62
62 -
 63
63 -
 64
64 -
 65
65 -
 66
66 -
 67
67 -
 68
68 -
 69
69 -
 70
70 -
71
-
72
-
73
-
74
-
75
-
76
-
77
-
78
-
79
-
80
-
81
-
82
-
83
-
84
-
85
-
86
-
87
-
88
-
89
-
90
-
91
-
92
-
93
-
94
-
95
-
96
-
97
-
98
-
99
-
100
-
101
-
102
-
103
-
104
-
105
-
106
-
107
-
108
-
109
-
110
-
111
-
112
-
113
-
114
-
115
-
116
-
117
-
118
-
119
-
120
-
121
-
122
-
123
-
124
-
125
-
126
-
127
-
128
-
129
-
130
-
131
-
132
 |
 |
Item 7. MANAGEMENT’S DISCUSSION AND ANALYSIS OF FINANCIAL CONDITION AND
RESULTS OF OPERATIONS – Continued
50
DISH Network subscribers. As of December 31, 2005, we had approximately 12.040 million DISH Network
subscribers compared to approximately 10.905 million subscribers at December 31, 2004, an increase of approximately
10.4%. DISH Network added approximately 3.397 million gross new subscribers for the year ended December 31,
2005, compared to approximately 3.441 million gross new subscribers during 2004, a decrease of approximately
44,000 gross new subscribers. The decrease in gross new subscribers resulted primarily from a decline in gross
activations under our co-branding agreement with AT&T, partially offset by an increase in sales through our agency
relationships and an increase in our other distribution channels.
DISH Network added approximately 1.135 million net new subscribers for the year ended December 31, 2005,
compared to approximately 1.480 million net new subscribers during 2004, a decrease of approximately 23.3%. This
decrease was primarily a result of increased subscriber churn on a larger subscriber base, and the result of a decline in
gross and net activations under our co-branding agreement with AT&T. In addition, even if percentage subscriber
churn had remained constant or had declined, increasing numbers of gross new subscribers are required to sustain
net subscriber growth.
Subscriber-related revenue. DISH Network “Subscriber-related revenue” totaled $7.986 billion for the year ended
December 31, 2005, an increase of $1.293 billion or 19.3% compared to 2004. This increase was directly
attributable to continued DISH Network subscriber growth and the increase in “ARPU” discussed below.
ARPU. Monthly average revenue per subscriber was $58.04 during the year ended December 31, 2005 versus $55.00
during the same period in 2004. The $3.04 or 5.5% increase in monthly average revenue per DISH Network
subscriber is primarily attributable to price increases in February 2005 and 2004 on some of our most popular
packages, higher equipment rental fees resulting from increased penetration of our equipment leasing programs,
availability of local channels by satellite and fees for DVRs. This increase was also attributable to our relationship
with AT&T, including revenues from equipment sales, installation and other services related to that agreement. These
improvements in ARPU were partially offset by an increase in our free and discounted programming promotions.
We provided local channels by satellite in 164 markets as of December 31, 2005 compared to 152 markets as of
December 31, 2004. We regularly have promotions to acquire new DISH Network subscribers which provide free
and/or discounted programming that negatively impact ARPU.
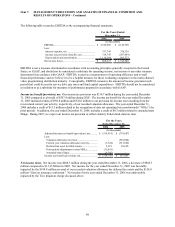
Equipment sales. For the year ended December 31, 2005, “Equipment sales” totaled $368.0 million, an increase of
$3.0 million or 0.8% compared to the same period during 2004. This increase principally resulted from an increase in
sales of non-DISH Network digital receivers and related components to an international DBS service provider, partially
offset by decreases in sales of DBS accessories domestically.
Subscriber-related expenses. “Subscriber-related expenses” totaled $4.096 billion during the year ended December
31, 2005, an increase of $477.7 million or 13.2% compared to 2004. The increase in “Subscriber-related expenses”
was primarily attributable to the increase in the number of DISH Network subscribers, which resulted in increased
expenses to support the DISH Network. “Subscriber-related expenses” represented 51.3% and 54.1% of
“Subscriber-related revenue” during the years ended December 31, 2005 and 2004, respectively. The decrease in
this expense to revenue ratio primarily resulted from the increase in “Subscriber-related revenue” and an increase in
the number of DISH Network subscribers participating in our lease program for existing subscribers. Since certain
subscriber retention costs associated with this program are capitalized rather than expensed, our “Subscriber-related
expenses” decreased and our capital expenditures increased. The decrease in the ratio also resulted from improved
efficiencies associated with our installation and in-home service operations. The decrease in this expense to revenue
ratio was partially offset by increases in cost associated with deferred equipment sales, installation and other
services related to our relationship under our prior agreement with AT&T. The decrease in the ratio was also
partially offset by $15.7 million more in charges during 2005 compared to 2004 for the replacement of smart cards.
Satellite and transmission expenses. “Satellite and transmission expenses” totaled $134.5 million during the year
ended December 31, 2005, an increase of $22.3 million or 19.9% compared to 2004. This increase primarily resulted
from commencement of service and operational costs associated with the increasing number of markets in which we
offer local broadcast channels by satellite as previously discussed, increases in our satellite lease payment
obligations for AMC-2, and operational costs associated with our capital leases of AMC-15 and AMC-16 which
commenced commercial operation in January and February 2005, respectively. “Satellite and transmission
expenses” totaled 1.7% of “Subscriber-related revenue” during each of the years ended December 31, 2005 and