Dish Network 2005 Annual Report Download - page 48
Download and view the complete annual report
Please find page 48 of the 2005 Dish Network annual report below. You can navigate through the pages in the report by either clicking on the pages listed below, or by using the keyword search tool below to find specific information within the annual report.-
 1
1 -
2
-
3
-
4
-
5
-
6
-
7
-
8
-
9
-
10
-
11
-
12
-
13
-
14
-
15
-
16
-
17
-
18
-
19
-
20
-
21
-
22
-
23
-
24
-
25
-
26
-
27
-
28
-
29
-
30
-
31
-
32
-
33
-
34
-
35
-
36
-
37
-
 38
38 -
 39
39 -
 40
40 -
 41
41 -
 42
42 -
 43
43 -
 44
44 -
 45
45 -
 46
46 -
 47
47 -
 48
48 -
 49
49 -
 50
50 -
 51
51 -
 52
52 -
 53
53 -
 54
54 -
 55
55 -
 56
56 -
 57
57 -
 58
58 -
59
-
60
-
61
-
62
-
63
-
64
-
65
-
66
-
67
-
68
-
69
-
70
-
71
-
72
-
73
-
74
-
75
-
76
-
77
-
78
-
79
-
80
-
81
-
82
-
83
-
84
-
85
-
86
-
87
-
88
-
89
-
90
-
91
-
92
-
93
-
94
-
95
-
96
-
97
-
98
-
99
-
100
-
101
-
102
-
103
-
104
-
105
-
106
-
107
-
108
-
109
-
110
-
111
-
112
-
113
-
114
-
115
-
116
-
117
-
118
-
119
-
120
-
121
-
122
-
123
-
124
-
125
-
126
-
127
-
128
-
129
-
130
-
131
-
132
 |
 |

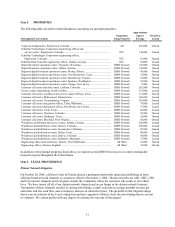
38
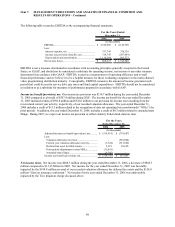
For the Years Ended December 31,
2006 2005 2004 2003 2002
Statements of Operations Data (In thousands, except per share data)
Revenue:
Subscriber-related revenue............................................................... 9,375,519$ 7,986,394$ 6,692,949$ 5,419,733$ 4,439,726$
Equipment sales................................................................................ 362,098 367,968 364,929 285,551 338,602
Other ................................................................................................ 80,869 92,813 100,593 34,012 42,497
Total revenue ...................................................................................... 9,818,486 8,447,175 7,158,471 5,739,296 4,820,825
Costs and Expenses:
Subscriber-related expenses (exclusive of
depreciation shown below)............................................................... 4,807,872 4,095,986 3,618,259 2,738,821 2,222,593
Satellite and transmission expenses (exclusive
of depreciation shown below)........................................................... 147,450 134,545 112,239 79,322 62,131
Cost of sales – equipment ................................................................... 282,420 271,697 259,058 161,724 204,655
Cost of sales – other ........................................................................... 7,260 23,339 33,265 3,496 6,466
Subscriber acquisition costs................................................................ 1,596,303 1,492,581 1,527,886 1,312,068 1,168,649
General and administrative ................................................................. 551,547 456,206 398,898 336,267 331,194
Tivo litigation expense........................................................................ 93,969 - - - -
Depreciation and amortization............................................................ 1,114,294 805,573 505,561 400,050 373,619
Total costs and expenses ................................................................... 8,601,115 7,279,927 6,455,166 5,031,748 4,369,307
Operating income (loss) ..................................................................... 1,217,371$ 1,167,248$ 703,305$ 707,548$ 451,518$
Net income (loss) .............................................................................. 608,272$ 1,514,540$ (3) 214,769$ 224,506$ (852,034)$ (1)
Basic net income (loss) available to common stockholders .............. 608,272
$ 1,514,540$ 214,769$ 224,506$ (414,601)$ (2)
Diluted net income (loss) available to common stockholders ........... 618,106$ 1,560,688$ (3) 214,769$ 224,506$ (414,601)$ (2)
Basic weighted-average common shares outstanding.......................... 444,743 452,118 464,053 483,098 480,429
Diluted weighted-average common shares outstanding....................... 452,685 484,131 467,598 488,314 480,429
Basic net income (loss) per share ....................................................... 1.37$ 3.35$ 0.46$ 0.46$ (0.86)$
Diluted net income (loss) per share .................................................... 1.37$ 3.22$ 0.46$ 0.46$ (0.86)$
Cash dividend per common share........................................................ -$ -$ 1.00$ -$ -$
As of December 31,
2006 2005 2004 2003 2002
Balance Sheet Data (In thousands)
Cash, cash equivalents and marketable
investment securities.......................................................................... 3,032,570$ 1,181,360$ 1,155,633$ 3,972,974$ 2,686,995$
Restricted cash and marketable investment securities.......................... 172,941 67,120 57,552 19,974 9,972
Cash reserved for satellite insurance.................................................... - - - 176,843 151,372
Total assets.......................................................................................... 9,768,696 7,410,210 6,029,277 7,585,018 6,260,585
Long-term obligations (including current portion).............................. 6,967,321 5,935,301 5,791,561 6,937,673 5,747,053
Total stockholders' equity (deficit)...................................................... (219,383) (866,624) (2,078,212) (1,032,524) (1,176,022)
For the Years Ended December 31,
Other Data 2006 2005 2004 2003 2002
DISH Network subscribers, as of period end (in millions)................. 13.105 12.040 10.905 9.425 8.180
DISH Network subscriber additions, gross (in millions).................... 3.516 3.397 3.441 2.894 2.764
DISH Network subscriber additions, net (in millions)........................ 1.065 1.135 1.480 1.245 1.350
Average monthly subscriber churn rate.............................................. 1.64% 1.65% 1.62% 1.57% 1.59%
Average monthly revenue per subscriber ("ARPU")......................... 62.47$ 58.04$ 55.00$ 51.30$ 49.48$
Average subscriber acquisition costs per subscriber ("SAC")............ 686$ 693$ 611$ 491$ 523$
Net cash flows from (in thousands):
Operating activities ....................................................................... 2,279,242$ 1,774,074$ 1,001,442$ 575,581$ 66,744$
Investing activities ........................................................................ (1,993,953)$ (1,460,342)$ 1,078,281$ (1,761,870)$ (682,387)$
Financing activities ....................................................................... 1,022,147$ (402,623)$ (2,666,022)$ 994,070$ 420,832$
(1) Net loss in 2002 includes $689.8 million related to merger termination costs.
(2) The net loss to common stockholders in 2002 of $414.6 million differs significantly from the net loss in 2002 of $852.0 million
due to a gain on repurchase of Series D Convertible Preferred Stock of approximately $437.4 million.
(3) Net income in 2005 includes $592.8 million and $322.0 million resulting from the reversal and current year activity,
respectively, of our recorded valuation allowance for those net deferred tax assets that we believe are more likely than not to be
realized in the future (see Note 6 in the Notes to the Consolidated Financial Statements in Item 15 of this Annual Report on Form
10-K).