Dish Network 2005 Annual Report Download - page 58
Download and view the complete annual report
Please find page 58 of the 2005 Dish Network annual report below. You can navigate through the pages in the report by either clicking on the pages listed below, or by using the keyword search tool below to find specific information within the annual report.-
 1
1 -
2
-
3
-
4
-
5
-
6
-
7
-
8
-
9
-
10
-
11
-
12
-
13
-
14
-
15
-
16
-
17
-
18
-
19
-
20
-
21
-
22
-
23
-
24
-
25
-
26
-
27
-
28
-
29
-
30
-
31
-
32
-
33
-
34
-
35
-
36
-
37
-
38
-
39
-
40
-
41
-
42
-
43
-
44
-
45
-
46
-
47
-
 48
48 -
 49
49 -
 50
50 -
 51
51 -
 52
52 -
 53
53 -
 54
54 -
 55
55 -
 56
56 -
 57
57 -
 58
58 -
 59
59 -
 60
60 -
 61
61 -
 62
62 -
 63
63 -
 64
64 -
 65
65 -
 66
66 -
 67
67 -
 68
68 -
69
-
70
-
71
-
72
-
73
-
74
-
75
-
76
-
77
-
78
-
79
-
80
-
81
-
82
-
83
-
84
-
85
-
86
-
87
-
88
-
89
-
90
-
91
-
92
-
93
-
94
-
95
-
96
-
97
-
98
-
99
-
100
-
101
-
102
-
103
-
104
-
105
-
106
-
107
-
108
-
109
-
110
-
111
-
112
-
113
-
114
-
115
-
116
-
117
-
118
-
119
-
120
-
121
-
122
-
123
-
124
-
125
-
126
-
127
-
128
-
129
-
130
-
131
-
132
 |
 |

Item 7. MANAGEMENT’S DISCUSSION AND ANALYSIS OF FINANCIAL CONDITION AND
RESULTS OF OPERATIONS – Continued
48
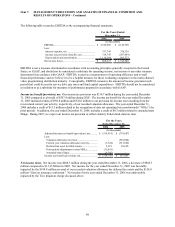
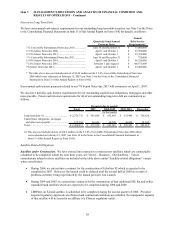
The following table reconciles EBITDA to the accompanying financial statements:
For the Years Ended
December 31,
2006 2005
(In thousands)
EBITDA............................................................... 2,369,058$ 2,142,990$
Less:
Interest expense, net .......................................... 331,749 330,326
Income tax provision (benefit), net..................... 314,743 (507,449)
Depreciation and amortization........................... 1,114,294 805,573
Net income (loss).................................................. 608,272$ 1,514,540$
EBITDA is not a measure determined in accordance with accounting principles generally accepted in the United
States, or GAAP, and should not be considered a substitute for operating income, net income or any other measure
determined in accordance with GAAP. EBITDA is used as a measurement of operating efficiency and overall
financial performance and we believe it to be a helpful measure for those evaluating companies in the multi-channel
video programming distribution industry. Conceptually, EBITDA measures the amount of income generated each
period that could be used to service debt, pay taxes and fund capital expenditures. EBITDA should not be considered
in isolation or as a substitute for measures of performance prepared in accordance with GAAP.
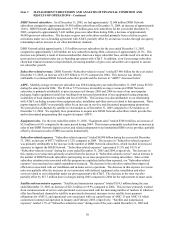
Income tax benefit (provision), net. Our income tax provision was $314.7 million during the year ended December
31, 2006 compared to a benefit of $507.4 million during 2005. The income tax benefit for the year ended December
31, 2005 included credits of $592.8 million and $322.0 million to our provision for income taxes resulting from the
reversal and current year activity, respectively, of our recorded valuation allowance. The year ended December 31,
2006 includes a credit of $13.5 million related to the recognition of state net operating loss carryforwards (“NOLs”) for
prior periods. In addition, the year ended December 31, 2006, includes a credit of $8.3 million related to amended state
filings. During 2007, we expect our income tax provision to reflect statutory Federal and state tax rates.
For the Years
Ended December 31,
2006 2005
(In thousands)
Adjusted income tax benefit (provision), net........... (338,514)$ (378,687)$
Less:
Valuation allowance reversal................................ - (592,804)
Current year valuation allowance activity............. (7,324) (321,982)
Deferred tax asset for filed returns........................ 5,319 28,650
Prior period adjustments to state NOLs................ (13,461) -
Amended state filings............................................ (8,305) -
Income tax benefit (provision), net.......................... (314,743)$ 507,449$
Net income (loss). Net income was $608.3 million during the year ended December 31, 2006, a decrease of $906.3
million compared to $1.515 billion in 2005. Net income for the year ended December 31, 2005 was favorably
impacted by the $914.8 million reversal of our recorded valuation allowance for deferred tax assets and the $134.0
million “Gain on insurance settlement.” Net income for the year ended December 31, 2006 was unfavorably
impacted by the Tivo litigation charge discussed above.