Dell 2009 Annual Report Download - page 99
Download and view the complete annual report
Please find page 99 of the 2009 Dell annual report below. You can navigate through the pages in the report by either clicking on the pages listed below, or by using the keyword search tool below to find specific information within the annual report.-
 1
1 -
2
-
3
-
4
-
5
-
6
-
7
-
8
-
9
-
10
-
11
-
12
-
13
-
14
-
15
-
16
-
17
-
18
-
19
-
20
-
21
-
22
-
23
-
24
-
25
-
26
-
27
-
28
-
29
-
30
-
31
-
32
-
33
-
34
-
35
-
36
-
37
-
38
-
39
-
40
-
41
-
42
-
43
-
44
-
45
-
46
-
47
-
48
-
49
-
50
-
51
-
52
-
53
-
54
-
55
-
56
-
57
-
58
-
59
-
60
-
61
-
62
-
63
-
64
-
65
-
66
-
67
-
68
-
69
-
70
-
71
-
72
-
73
-
74
-
75
-
76
-
77
-
78
-
79
-
80
-
81
-
82
-
83
-
84
-
85
-
86
-
87
-
88
-
 89
89 -
 90
90 -
 91
91 -
 92
92 -
 93
93 -
 94
94 -
 95
95 -
 96
96 -
 97
97 -
 98
98 -
 99
99 -
 100
100 -
 101
101 -
 102
102 -
 103
103 -
 104
104 -
 105
105 -
 106
106 -
 107
107 -
 108
108 -
 109
109 -
110
-
111
-
112
-
113
-
114
-
115
-
116
-
117
-
118
-
119
-
120
-
121
-
122
-
123
-
124
-
125
-
126
 |
 |
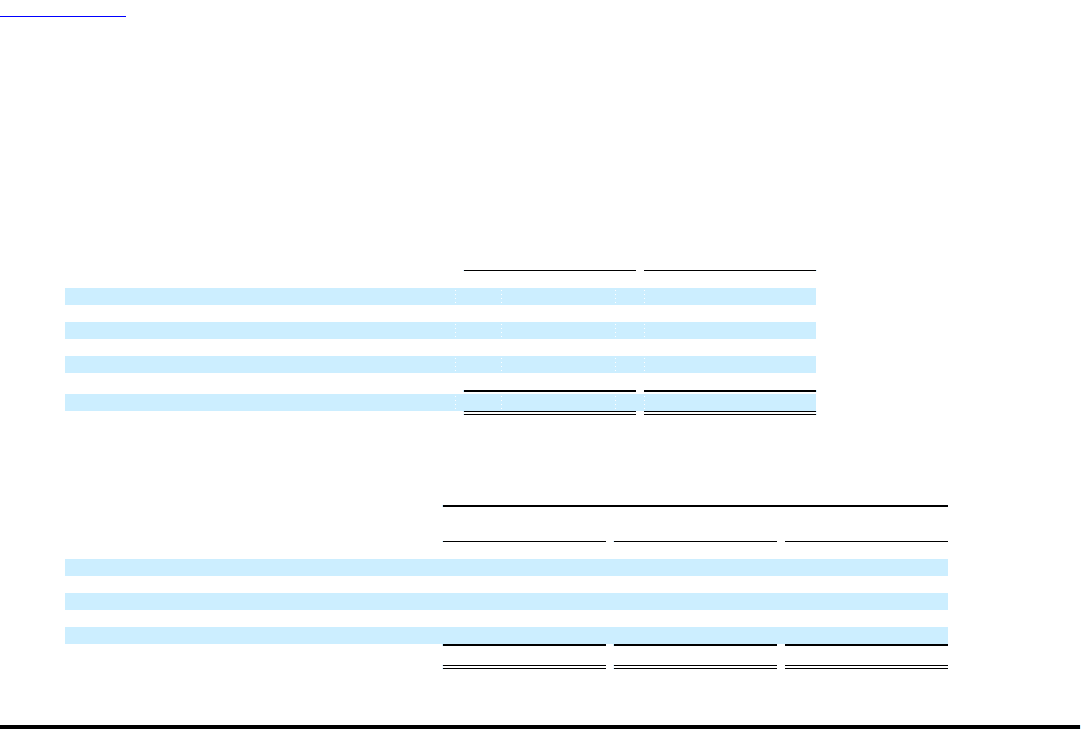
Table of Contents
DELL INC.
NOTES TO CONSOLIDATED FINANCIAL STATEMENTS (Continued)
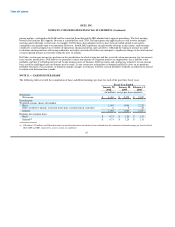
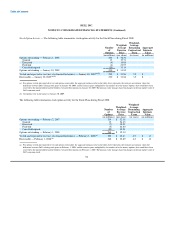
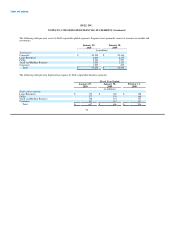
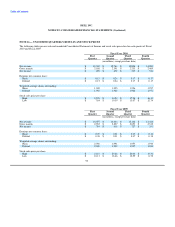
The following table presents assets by Dell's reportable global segments. Segment assets primarily consist of accounts receivable and
inventories.
January 29, January 30,
2010 2009
(in millions)
Total assets:
Corporate $ 26,240 $ 20,346
Large Enterprise 2,604 2,335
Public 2,464 1,997
Small and Medium Business 1,051 1,123
Consumer 1,293 699
Total $ 33,652 $ 26,500
The following table presents depreciation expense by Dell's reportable business segments:
Fiscal Year Ended
January 29, January 30, February 1,
2010 2009 2008
(in millions)
Depreciation expense:
Large Enterprise $ 175 $ 180 $ 158
Public 177 174 164
Small and Medium Business 148 151 127
Consumer 147 161 147
Total $ 647 $ 666 $ 596
95