Dell 2009 Annual Report Download - page 42
Download and view the complete annual report
Please find page 42 of the 2009 Dell annual report below. You can navigate through the pages in the report by either clicking on the pages listed below, or by using the keyword search tool below to find specific information within the annual report.-
 1
1 -
2
-
3
-
4
-
5
-
6
-
7
-
8
-
9
-
10
-
11
-
12
-
13
-
14
-
15
-
16
-
17
-
18
-
19
-
20
-
21
-
22
-
23
-
24
-
25
-
26
-
27
-
28
-
29
-
30
-
31
-
 32
32 -
 33
33 -
 34
34 -
 35
35 -
 36
36 -
 37
37 -
 38
38 -
 39
39 -
 40
40 -
 41
41 -
 42
42 -
 43
43 -
 44
44 -
 45
45 -
 46
46 -
 47
47 -
 48
48 -
 49
49 -
 50
50 -
 51
51 -
 52
52 -
53
-
54
-
55
-
56
-
57
-
58
-
59
-
60
-
61
-
62
-
63
-
64
-
65
-
66
-
67
-
68
-
69
-
70
-
71
-
72
-
73
-
74
-
75
-
76
-
77
-
78
-
79
-
80
-
81
-
82
-
83
-
84
-
85
-
86
-
87
-
88
-
89
-
90
-
91
-
92
-
93
-
94
-
95
-
96
-
97
-
98
-
99
-
100
-
101
-
102
-
103
-
104
-
105
-
106
-
107
-
108
-
109
-
110
-
111
-
112
-
113
-
114
-
115
-
116
-
117
-
118
-
119
-
120
-
121
-
122
-
123
-
124
-
125
-
126
 |
 |

Table of Contents
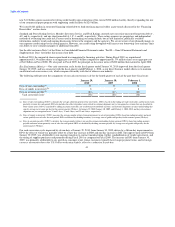
Cash and Investments
At January 29, 2010, we had $11.8 billion of total cash, cash equivalents, and investments. The objective of our investment policy and
strategy is to manage our total cash and investments balances to preserve principal and maintain liquidity while maximizing the return on
the investment portfolio through the full investment of available funds. We diversify our investment portfolio by investing in multiple
types of investment-grade securities and through the use of third-party investment managers.
Of the $11.8 billion of cash, cash equivalents, and investments, $10.6 billion is classified as cash and cash equivalents. Our cash
equivalents primarily consist of money market funds. Due to the nature of these investments, we consider it reasonable to expect that they
will not be significantly impacted by a change in interest rates, and that these investments can be liquidated for cash at short notice. As of
January 29, 2010, our cash equivalents are recorded primarily at cost, which approximates fair value.
The remaining $1.2 billion of cash, cash equivalents, and investments is primarily invested in fixed income securities, including
government, agency, asset-backed, and corporate debt securities of varying maturities at the date of acquisition. The fair value of our
portfolio is affected primarily by interest rates more than by credit and liquidity risks. We attempt to mitigate these risks by investing
primarily in high credit quality securities with AAA and AA ratings and short-term securities with an A-1 rating, limiting the amount that
can be invested in any single issuer, and investing in short– to intermediate-term investments whose market value is less sensitive to
interest rate changes. Our exposure to asset and mortgage-backed securities is less than 1% of the value of the portfolio. The total
carrying value of investments in asset-backed and mortgage-backed debt securities was approximately $4 million and $54 million at
January 29, 2010 and January 30, 2009, respectively. Based on our investment portfolio and interest rates at January 29, 2010, a 100 basis
point increase or decrease in interest rates would result in a decrease or increase of approximately $4 million in the fair value of the
investment portfolio.
We periodically review our investment portfolio to determine if any investment is other-than-temporarily impaired due to changes in
credit risk or other potential valuation concerns. At January 29, 2010, our portfolio included securities with unrealized losses totaling
$2 million, which have been recorded in other comprehensive income (loss), as we believe the investments are not other-than-temporarily
impaired. While these available-for-sale securities have market values below cost, we believe it is probable that the principal and interest
will be collected in accordance with the contractual terms, and that the decline in the market value is primarily due to changes in interest
rates and not increased credit risk.
The fair value of our portfolio is based on prices provided from national pricing services, which we currently believe are indicative of fair
value, as our assessment is that the inputs are market observable. We will continue to evaluate whether the inputs are market observable
in accordance with the accounting guidance on fair value measurements. We conduct reviews on a quarterly basis to verify pricing, assess
liquidity, and determine if significant inputs have changed that would impact our fair value disclosures.
LIQUIDITY, CAPITAL COMMITMENTS, AND CONTRACTUAL CASH OBLIGATIONS
Current Market Conditions
We regularly monitor economic conditions and associated impacts on the financial markets and our business. During the second half of
Fiscal 2010, as the global capital markets showed some improvements, we continued to be cautious given the downturn in the
macroeconomic environment and the recent instability of the financial markets. We continue to evaluate the financial health of our
supplier base, carefully manage customer credit, diversify counterparty risk, and monitor the concentration risk of our cash and cash
equivalents balances globally. Additionally, we maintain a conservative investment portfolio with shorter duration and high quality
assets.
We monitor credit risk associated with our financial counterparties using various market credit risk indicators such as credit ratings issued
by nationally recognized rating agencies and changes in market credit default swap levels. We perform periodic evaluations of our
positions with these counterparties and may limit exposure to any one counterparty in accordance with our policies. We monitor and
manage these activities depending on current and expected market developments.
38