Dell 2009 Annual Report Download - page 98
Download and view the complete annual report
Please find page 98 of the 2009 Dell annual report below. You can navigate through the pages in the report by either clicking on the pages listed below, or by using the keyword search tool below to find specific information within the annual report.-
 1
1 -
2
-
3
-
4
-
5
-
6
-
7
-
8
-
9
-
10
-
11
-
12
-
13
-
14
-
15
-
16
-
17
-
18
-
19
-
20
-
21
-
22
-
23
-
24
-
25
-
26
-
27
-
28
-
29
-
30
-
31
-
32
-
33
-
34
-
35
-
36
-
37
-
38
-
39
-
40
-
41
-
42
-
43
-
44
-
45
-
46
-
47
-
48
-
49
-
50
-
51
-
52
-
53
-
54
-
55
-
56
-
57
-
58
-
59
-
60
-
61
-
62
-
63
-
64
-
65
-
66
-
67
-
68
-
69
-
70
-
71
-
72
-
73
-
74
-
75
-
76
-
77
-
78
-
79
-
80
-
81
-
82
-
83
-
84
-
85
-
86
-
87
-
 88
88 -
 89
89 -
 90
90 -
 91
91 -
 92
92 -
 93
93 -
 94
94 -
 95
95 -
 96
96 -
 97
97 -
 98
98 -
 99
99 -
 100
100 -
 101
101 -
 102
102 -
 103
103 -
 104
104 -
 105
105 -
 106
106 -
 107
107 -
 108
108 -
109
-
110
-
111
-
112
-
113
-
114
-
115
-
116
-
117
-
118
-
119
-
120
-
121
-
122
-
123
-
124
-
125
-
126
 |
 |

Table of Contents
DELL INC.
NOTES TO CONSOLIDATED FINANCIAL STATEMENTS (Continued)
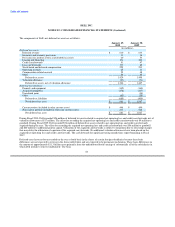
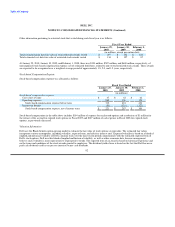
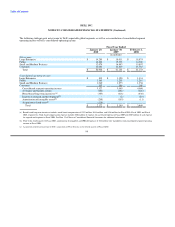
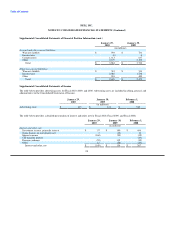
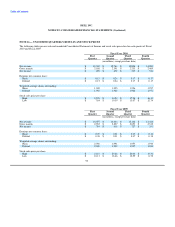
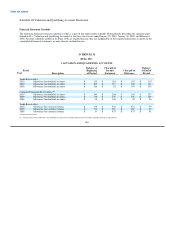
The following table presents net revenue by Dell's reportable global segments as well as a reconciliation of consolidated segment
operating income to Dell's consolidated operating income:
Fiscal Year Ended
January 29, January 30, February 1,
2010 2009 2008
(in millions)
Net revenue:
Large Enterprise $ 14,285 $ 18,011 $ 18,833
Public 14,484 15,338 14,708
Small and Medium Business 12,079 14,892 15,807
Consumer 12,054 12,860 11,785
Total $ 52,902 $ 61,101 $ 61,133
Consolidated operating income:
Large Enterprise $ 819 $ 1,158 $ 1,331
Public 1,361 1,258 1,261
Small and Medium Business 1,040 1,273 1,338
Consumer 107 306 160
Consolidated segment operating income 3,327 3,995 4,090
Severance and facility actions (481) (282) (120)
Broad based long-term incentives(a) (353) (418) (436)
In-process research and development(b) - (2) (83)
Amortization of intangible assets(b) (205) (103) (11)
Acquisition-related costs(c) (116) - -
Total $ 2,172 $ 3,190 $ 3,440
(a) Broad based long-term incentives includes stock-based compensation of $312 million, $418 million, and $436 million for Fiscal 2010, Fiscal 2009, and Fiscal
2008, respectively. Stock-based compensation expense includes $104 million of expense for accelerated options in Fiscal 2009 and $107 million of cash expense
for expired stock options in Fiscal 2008. See Note 13 of Notes to Consolidated Financial Statements for additional information.
(b) Prior to the fourth quarter of Fiscal 2008, amortization of intangibles and IPR&D expenses of $16 million were included in total consolidated segment operating
income in Fiscal 2008.
(c) Acquisition-related costs pertain to Dell's acquisition of Perot Systems in the fourth quarter of Fiscal 2010.
94