Dell 2009 Annual Report Download - page 34
Download and view the complete annual report
Please find page 34 of the 2009 Dell annual report below. You can navigate through the pages in the report by either clicking on the pages listed below, or by using the keyword search tool below to find specific information within the annual report.-
 1
1 -
2
-
3
-
4
-
5
-
6
-
7
-
8
-
9
-
10
-
11
-
12
-
13
-
14
-
15
-
16
-
17
-
18
-
19
-
20
-
21
-
22
-
23
-
 24
24 -
 25
25 -
 26
26 -
 27
27 -
 28
28 -
 29
29 -
 30
30 -
 31
31 -
 32
32 -
 33
33 -
 34
34 -
 35
35 -
 36
36 -
 37
37 -
 38
38 -
 39
39 -
 40
40 -
 41
41 -
 42
42 -
 43
43 -
 44
44 -
45
-
46
-
47
-
48
-
49
-
50
-
51
-
52
-
53
-
54
-
55
-
56
-
57
-
58
-
59
-
60
-
61
-
62
-
63
-
64
-
65
-
66
-
67
-
68
-
69
-
70
-
71
-
72
-
73
-
74
-
75
-
76
-
77
-
78
-
79
-
80
-
81
-
82
-
83
-
84
-
85
-
86
-
87
-
88
-
89
-
90
-
91
-
92
-
93
-
94
-
95
-
96
-
97
-
98
-
99
-
100
-
101
-
102
-
103
-
104
-
105
-
106
-
107
-
108
-
109
-
110
-
111
-
112
-
113
-
114
-
115
-
116
-
117
-
118
-
119
-
120
-
121
-
122
-
123
-
124
-
125
-
126
 |
 |

Table of Contents
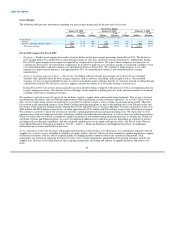
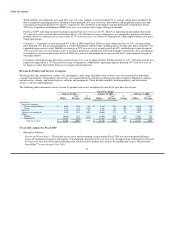
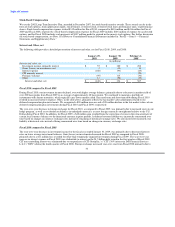
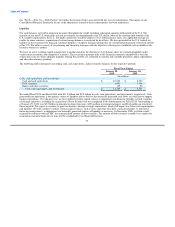
preference from desktops to notebooks has contributed to our mobility unit growth. The reduction in mobility average selling prices
was mainly attributable to our expansion into retail coupled with a demand shift from higher to lower priced notebooks and the
growing popularity of netbooks. Software and peripheral and services revenue also declined 12% and 16% year-over-year,
respectively, during Fiscal 2010. At a country level, our targeted BRIC revenue grew 46% during Fiscal 2010.
Consumer's operating income percentage declined approximately 1.5 percentage points year-over-year to 0.9%. Consumer's
operating performance was affected by a year-over-year decline in gross margin during Fiscal 2010 mainly due to the previously
mentioned revenue declines and to component cost pressures. Even though operating expenses decreased year-over-year, operating
expenses as a percentage of revenue remained relatively flat during Fiscal 2010 as compared to Fiscal 2009. During the fourth quarter
of Fiscal 2010, we announced plans to combine Consumer and SMB under a single leadership team to reduce overall costs, though
we will continue to manage and report the two segments separately.
During Fiscal 2010, Consumer's revenue and operating income was favorably impacted by a second quarter $53 million transaction,
in which a vendor purchased our contractual right to share in future revenues from product renewals sold by the vendor. Excluding
this transaction, Consumer's Fiscal 2010 operating income percentage would have been 0.4% instead of 0.9%. We may from time to
time enter into similar agreements as we intend to monetize other elements of the consumer business.
We sell desktop and notebook computers, printers, ink, toner, displays, and accessories through retailers. Our goal is to have strategic
relationships with a number of major retailers in our larger geographic regions. We expanded our global retail presence over the prior
year, and now reach over 56,000 retail locations worldwide, compared to 24,000 at the end of Fiscal 2009.
Fiscal 2009 compared to Fiscal 2008
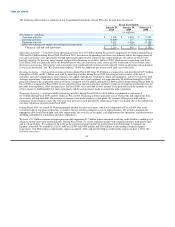
• Large Enterprise — In Fiscal 2009, both Large Enterprise's revenue and unit shipments decreased 4% year-over-year, while average
selling prices remained flat. The decline in revenue and unit shipments was directly attributable to the global economic downturn that
began in the latter half of Fiscal 2009. Average selling prices remained flat due to a product mix shift within Large Enterprise. Unit
sales of our more profitable servers and networking products increased 9% year-over-year during Fiscal 2009, while desktop and
mobility units declined 8% and 2%, respectively. Year-over-year revenue declines of 16% and 11% in mobility products and
desktops, respectively, drove Large Enterprise's revenue decrease. The decline in mobility and desktop revenue was due to weakened
demand and lower average selling prices in a competitive environment. Partially offsetting these declines was 8% revenue growth in
both services and software and peripherals.
For Fiscal 2009, operating income dollars declined 13% year-over-year, and operating income percentage decreased 70 basis points
year-over-year to 6.4% from 7.1%. Operating income deteriorated due to lower demand which drove decreases in both revenue and
costs of revenue.
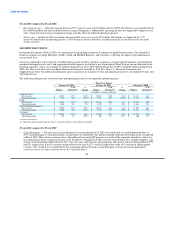
• Public — Public experienced a 4% year-over-year increase in revenue on a unit shipment increase of 3%. During Fiscal 2009,
Public's revenue grew year-over-year across all product categories except for desktops and mobility, which declined 6% and 1%,
respectively, as average selling prices dropped 10% for mobility and 6% for desktop products in a competitive pricing environment.
Public's revenue improvement was led by software and peripherals, services, and storage year-over-year revenue growth of 23%,
18%, and 15%, respectively.
For Fiscal 2009, operating income dollars remained flat on the revenue growth, while operating income dollars and percentage were
positively impacted by the growth in unit shipments and a 1% increase in average selling prices, the effects of which were partially
offset by a 5% increase in cost of revenue and a 3% increase in operating expenses.
• Small and Medium Business — During Fiscal 2009, SMB experienced a 6% year-over-year decline in revenue while unit shipments
remained flat. The decrease in revenue was mainly due to a 6% decline in average selling prices. For Fiscal 2009, SMB experienced a
revenue decline across all product and services categories except storage, whose revenue increased 36% year-over-year and services,
whose revenue remained relatively flat.
30