Dell 2009 Annual Report Download - page 31
Download and view the complete annual report
Please find page 31 of the 2009 Dell annual report below. You can navigate through the pages in the report by either clicking on the pages listed below, or by using the keyword search tool below to find specific information within the annual report.-
 1
1 -
2
-
3
-
4
-
5
-
6
-
7
-
8
-
9
-
10
-
11
-
12
-
13
-
14
-
15
-
16
-
17
-
18
-
19
-
20
-
 21
21 -
 22
22 -
 23
23 -
 24
24 -
 25
25 -
 26
26 -
 27
27 -
 28
28 -
 29
29 -
 30
30 -
 31
31 -
 32
32 -
 33
33 -
 34
34 -
 35
35 -
 36
36 -
 37
37 -
 38
38 -
 39
39 -
 40
40 -
 41
41 -
42
-
43
-
44
-
45
-
46
-
47
-
48
-
49
-
50
-
51
-
52
-
53
-
54
-
55
-
56
-
57
-
58
-
59
-
60
-
61
-
62
-
63
-
64
-
65
-
66
-
67
-
68
-
69
-
70
-
71
-
72
-
73
-
74
-
75
-
76
-
77
-
78
-
79
-
80
-
81
-
82
-
83
-
84
-
85
-
86
-
87
-
88
-
89
-
90
-
91
-
92
-
93
-
94
-
95
-
96
-
97
-
98
-
99
-
100
-
101
-
102
-
103
-
104
-
105
-
106
-
107
-
108
-
109
-
110
-
111
-
112
-
113
-
114
-
115
-
116
-
117
-
118
-
119
-
120
-
121
-
122
-
123
-
124
-
125
-
126
 |
 |

Table of Contents
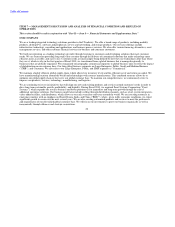
We expect integration costs related to our acquisition of Perot Systems to continue over the next fiscal years. In addition, we will
continue to review our costs across all processes and organizations with the goals of reducing complexity and eliminating
redundancies. Since the second quarter of Fiscal 2008 and through the end of Fiscal 2010, excluding the 23,800 employees we added
from Perot Systems, we have reduced headcount by approximately 20,000 and closed a number of our facilities. While we have made
significant progress in the transformation of our manufacturing and logistics areas, we expect to take further actions to reduce costs
while investing in strategic growth areas.
• Research, Development, and Engineering — During Fiscal 2010, research, development and engineering ("RD&E") expenses
remained approximately 1% of revenue, consistent with prior years. We manage our research, development, and engineering
spending by targeting those innovations and products that we believe are most valuable to our customers and by relying upon the
capabilities of our strategic relationships. We will continue to invest in RD&E activities to support our growth and to provide for
new, competitive products. We have obtained 2,577 worldwide patents and have applied for 2,418 additional worldwide patents as of
January 29, 2010.
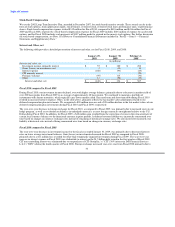
Fiscal 2009 compared to Fiscal 2008
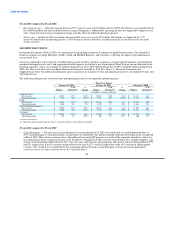
• Selling, General, and Administrative — During Fiscal 2009, SG&A expenses decreased primarily due to decreases in compensation
and benefits expense, advertising expenses, and costs associated with governmental investigations. Compensation and benefits
expense, excluding expenses related to headcount and infrastructure reductions, decreased approximately $250 million in Fiscal 2009
compared to Fiscal 2008, driven primarily by decreases in bonus-related expenses due to weaker company performance versus bonus
plan targets and lower sales commission expenses. Compensation-related expenses also included $73 million of stock option
acceleration expense in Fiscal 2009, while Fiscal 2008 included $76 million for the cash payments made for expiring stock options.
See Note 13 of Notes to Consolidated Financial Statements included in "Part II — Item 8 — Financial Statements and
Supplementary Data" for further information on stock-based compensation. With the increase in retail volumes and the associated
cooperative advertising programs, as well as other factors, advertising expenses decreased approximately $130 million from Fiscal
2008. Costs associated with the ongoing SEC investigation and the Audit Committee's completed independent investigation
decreased by $117 million from $160 million for Fiscal 2008 to $43 million for Fiscal 2009. These decreases were partially offset by
an increase in SG&A expenses related to headcount and infrastructure reductions through our on-going cost optimization efforts,
which were $136 million for Fiscal 2009 compared to $92 million for Fiscal 2008.
• Research, Development, and Engineering — The increase in RD&E expenses during Fiscal 2009 was primarily due to an
approximately $45 million increase in compensation and benefits expenses as we continued to expand our research and development
activities in our EqualLogicTM and Data Center Solutions offerings.
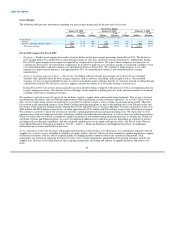
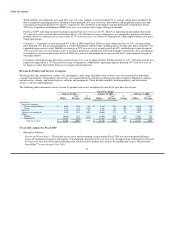
Operating and Net Income
Fiscal 2010 compared to Fiscal 2009
• Operating Income — During Fiscal 2010, operating income decreased 32% year-over-year to $2.2 billion. The decrease in operating
income was primarily attributable to a year-over-year revenue decline of 13% and a year-over-year decline in gross margin dollars of
15%. A 9% year-over-year reduction in operating expenses during Fiscal 2010 favorably impacted operating income, while operating
expenses as a percentage of revenue increased slightly during the same periods.
• Net Income — Net income decreased year-over-year during Fiscal 2010 by 42% to $1.4 billion. Net income was impacted by
significant declines in operating income and higher interest and other, net in Fiscal 2010 compared to Fiscal 2009. During Fiscal
2010 as compared to Fiscal 2009, net income was negatively impacted by an increase in our effective tax rate to 29.2% from 25.4%.
See "Income and Other Taxes" below for a discussion of our effective tax rates.
27