Dell 2009 Annual Report Download - page 94
Download and view the complete annual report
Please find page 94 of the 2009 Dell annual report below. You can navigate through the pages in the report by either clicking on the pages listed below, or by using the keyword search tool below to find specific information within the annual report.-
 1
1 -
2
-
3
-
4
-
5
-
6
-
7
-
8
-
9
-
10
-
11
-
12
-
13
-
14
-
15
-
16
-
17
-
18
-
19
-
20
-
21
-
22
-
23
-
24
-
25
-
26
-
27
-
28
-
29
-
30
-
31
-
32
-
33
-
34
-
35
-
36
-
37
-
38
-
39
-
40
-
41
-
42
-
43
-
44
-
45
-
46
-
47
-
48
-
49
-
50
-
51
-
52
-
53
-
54
-
55
-
56
-
57
-
58
-
59
-
60
-
61
-
62
-
63
-
64
-
65
-
66
-
67
-
68
-
69
-
70
-
71
-
72
-
73
-
74
-
75
-
76
-
77
-
78
-
79
-
80
-
81
-
82
-
83
-
 84
84 -
 85
85 -
 86
86 -
 87
87 -
 88
88 -
 89
89 -
 90
90 -
 91
91 -
 92
92 -
 93
93 -
 94
94 -
 95
95 -
 96
96 -
 97
97 -
 98
98 -
 99
99 -
 100
100 -
 101
101 -
 102
102 -
 103
103 -
 104
104 -
105
-
106
-
107
-
108
-
109
-
110
-
111
-
112
-
113
-
114
-
115
-
116
-
117
-
118
-
119
-
120
-
121
-
122
-
123
-
124
-
125
-
126
 |
 |
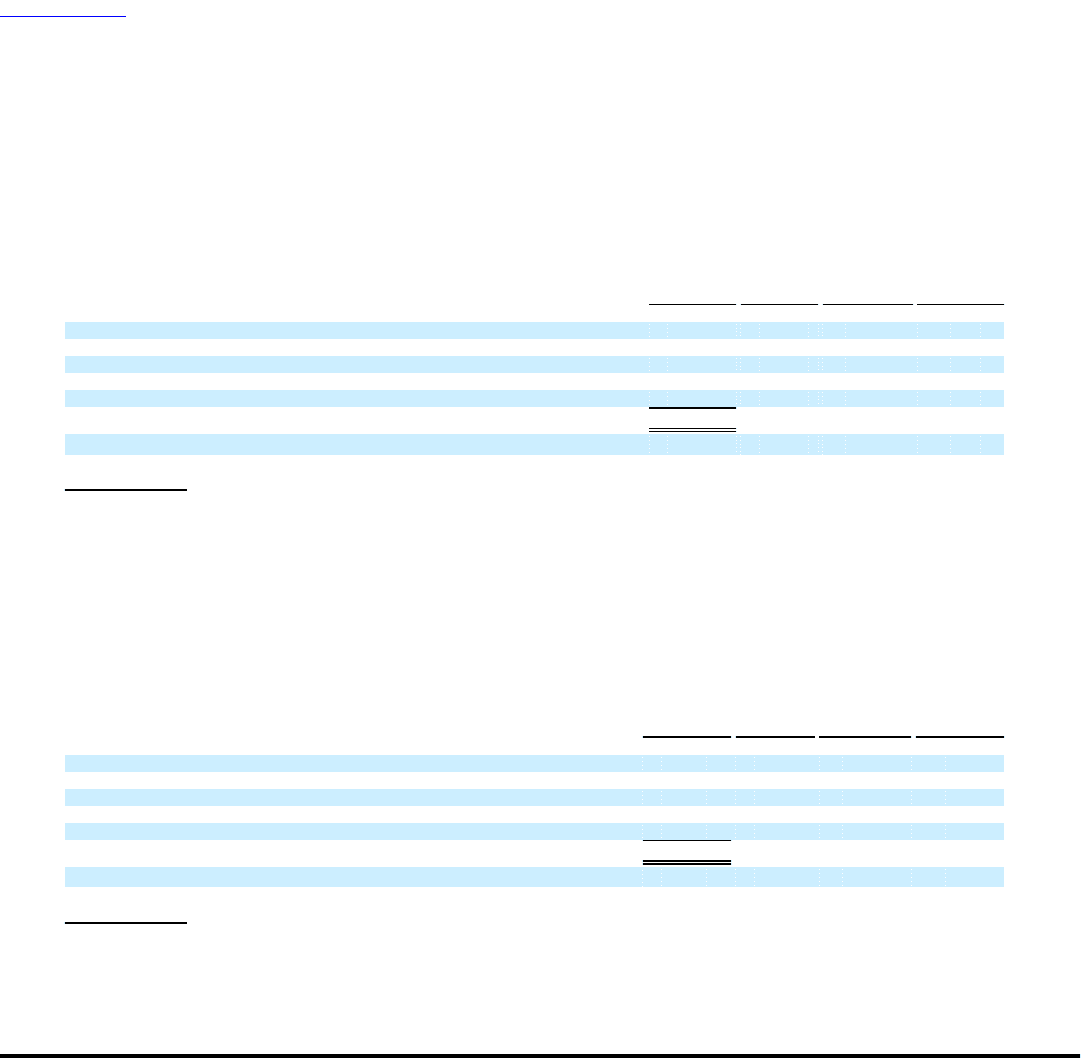
Table of Contents
DELL INC.
NOTES TO CONSOLIDATED FINANCIAL STATEMENTS (Continued)
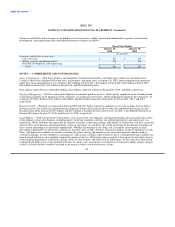
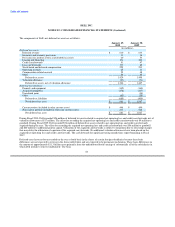
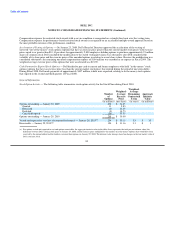
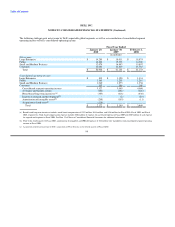
Stock Option Activity — The following table summarizes stock option activity for the Stock Plans during Fiscal 2009:
Weighted-
Weighted- Average
Number Average Remaining Aggregate
of Exercise Contractual Intrinsic
Options Price Term Value
(in millions) (per share) (in years) (in millions)
Options outstanding — February 1, 2008 264 $ 32.30
Granted 13 19.71
Exercised (4) 19.08
Forfeited (4) 23.97
Cancelled/expired (39) 33.14
Options outstanding — January 30, 2009 230 $ 31.85
Vested and expected to vest (net of estimated forfeitures) — January 30, 2009(a)(b) 230 $ 31.86 3.9 $ -
Exercisable — January 30, 2009(a)(b) 230 $ 31.86 3.9 $ -
(a) For options vested and expected to vest and options exercisable, the aggregate intrinsic value in the table above represents the total pre-tax intrinsic value (the
difference between Dell's closing stock price on January 30, 2009, and the exercise price multiplied by the number of in-the-money options) that would have been
received by the option holders had the holders exercised their options on January 30, 2009. The intrinsic value changes based on changes in the fair market value of
Dell's common stock.
(b) No options were in-the-money at January 30, 2009.
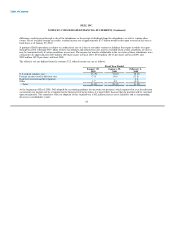
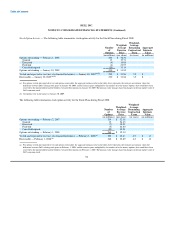
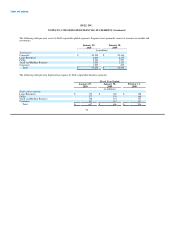
The following table summarizes stock option activity for the Stock Plans during Fiscal 2008:
Weighted-
Weighted- Average
Number Average Remaining Aggregate
of Exercise Contractual Intrinsic
Options Price Term Value
(in millions) (per share) (in years) (in millions)
Options outstanding — February 2, 2007 314 $ 32.16
Granted 12 24.45
Exercised (7) 18.99
Forfeited (5) 26.80
Cancelled/expired (50) 32.01
Options outstanding — February 1, 2008 264 $ 32.30
Vested and expected to vest (net of estimated forfeitures) — February 1, 2008(a) 259 $ 32.43 4.5 $ 13
Exercisable — February 1, 2008(a) 242 $ 32.89 4.2 $ 12
(a) For options vested and expected to vest and options exercisable, the aggregate intrinsic value in the table above represents the total pre-tax intrinsic value (the
difference between Dell's closing stock price on February 1, 2008, and the exercise price multiplied by the number of in-the-money options) that would have been
received by the option holders had the holders exercised their options on February 1, 2008. The intrinsic value changes based on changes in the fair market value of
Dell's common stock.
90