Dell 2009 Annual Report Download - page 38
Download and view the complete annual report
Please find page 38 of the 2009 Dell annual report below. You can navigate through the pages in the report by either clicking on the pages listed below, or by using the keyword search tool below to find specific information within the annual report.-
 1
1 -
2
-
3
-
4
-
5
-
6
-
7
-
8
-
9
-
10
-
11
-
12
-
13
-
14
-
15
-
16
-
17
-
18
-
19
-
20
-
21
-
22
-
23
-
24
-
25
-
26
-
27
-
 28
28 -
 29
29 -
 30
30 -
 31
31 -
 32
32 -
 33
33 -
 34
34 -
 35
35 -
 36
36 -
 37
37 -
 38
38 -
 39
39 -
 40
40 -
 41
41 -
 42
42 -
 43
43 -
 44
44 -
 45
45 -
 46
46 -
 47
47 -
 48
48 -
49
-
50
-
51
-
52
-
53
-
54
-
55
-
56
-
57
-
58
-
59
-
60
-
61
-
62
-
63
-
64
-
65
-
66
-
67
-
68
-
69
-
70
-
71
-
72
-
73
-
74
-
75
-
76
-
77
-
78
-
79
-
80
-
81
-
82
-
83
-
84
-
85
-
86
-
87
-
88
-
89
-
90
-
91
-
92
-
93
-
94
-
95
-
96
-
97
-
98
-
99
-
100
-
101
-
102
-
103
-
104
-
105
-
106
-
107
-
108
-
109
-
110
-
111
-
112
-
113
-
114
-
115
-
116
-
117
-
118
-
119
-
120
-
121
-
122
-
123
-
124
-
125
-
126
 |
 |

Table of Contents
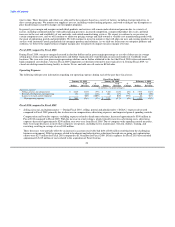
Stock-Based Compensation
We use the 2002 Long-Term Incentive Plan, amended in December 2007, for stock-based incentive awards. These awards can be in the
form of stock options, stock appreciation rights, stock bonuses, restricted stock, restricted stock units, performance units, or performance
shares. Stock-based compensation expense totaled $312 million for Fiscal 2010, compared to $418 million and $436 million for Fiscal
2009 and Fiscal 2008, respectively. Stock-based compensation expense for Fiscal 2009 includes $104 million of expense for accelerated
options, and for Fiscal 2008 includes cash payments of $107 million made for expired in-the-money stock options. For further discussion
on stock-based compensation, see Note 13 of Notes to Consolidated Financial Statements included in "Part II — Item 8 — Financial
Statements and Supplementary Data."
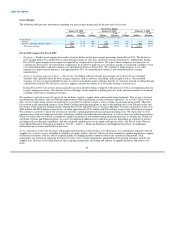
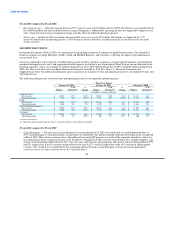
Interest and Other, net
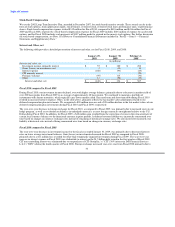
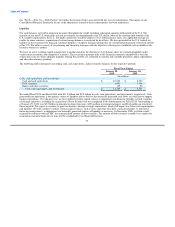
The following table provides a detailed presentation of interest and other, net for Fiscal 2010, 2009, and 2008:
January 29, January 30, February 1,
2010 2009 2008
(in millions)
Interest and other, net:
Investment income, primarily interest $ 57 $ 180 $ 496
Gains (losses) on investments, net 2 (10) 14
Interest expense (160) (93) (45)
CIT minority interest - - (29)
Foreign exchange (59) 115 (30)
Other 12 (58) (19)
Interest and other, net $ (148) $ 134 $ 387
Fiscal 2010 compared to Fiscal 2009
During Fiscal 2010, our investment income declined, even with higher average balances, primarily due to a decrease in market yield of
over 200 basis points from Fiscal 2009 to an average of approximately 48 basis points. We continued to maintain a portfolio of
instruments with shorter maturities, which typically carry lower market yields. Increased term and short-term debt during Fiscal 2010
resulted in increased interest expense. Other, in the table above, primarily reflects the fair market value adjustments related to our
deferred compensation plan investments. We recognized a $24 million increase and a $35 million decline in the fair market values of our
deferred compensation plan investments during Fiscal 2010 and Fiscal 2009, respectively.
The year-over-year decrease in foreign exchange for Fiscal 2010, as compared to Fiscal 2009, was primarily due to increased costs on our
hedge program, as well as revaluation on balances in unhedged currencies, as most foreign currencies strengthened relative to the U.S.
Dollar during Fiscal 2010. In addition, for Fiscal 2009, a $42 million gain resulted from the correction of errors in the remeasurement of
certain local currency balances to the functional currency in prior periods. A deferred revenue liability was incorrectly remeasured over
time based on changes in currency exchange rates instead of remaining at historical exchange rates. We also incorrectly measured a tax
liability at historical rates instead of being remeasured over time based on changes in currency exchange rates.
Fiscal 2009 compared to Fiscal 2008
The year-over-year decrease in investment income for the fiscal year ended January 30, 2009, was primarily due to decreased interest
rates on lower average investment balances. Gain (losses) on investments decreased for Fiscal 2009 as compared to Fiscal 2008,
primarily due to a $11 million loss recorded for other-than-temporarily impaired investments during Fiscal 2009. The year-over-year
increase in interest expense in Fiscal 2009 was attributable to interest on the $1.5 billion debt issued in the first quarter of Fiscal 2009.
CIT non-controlling interest was eliminated due to our purchase of CIT Group Inc.'s ("CIT") 30% interest in Dell Financial Services
L.L.C. ("DFS") during the fourth quarter of Fiscal 2008. Foreign exchange increased year-over-year from Fiscal 2008 primarily due to
34