Dell 2009 Annual Report Download - page 57
Download and view the complete annual report
Please find page 57 of the 2009 Dell annual report below. You can navigate through the pages in the report by either clicking on the pages listed below, or by using the keyword search tool below to find specific information within the annual report.-
 1
1 -
2
-
3
-
4
-
5
-
6
-
7
-
8
-
9
-
10
-
11
-
12
-
13
-
14
-
15
-
16
-
17
-
18
-
19
-
20
-
21
-
22
-
23
-
24
-
25
-
26
-
27
-
28
-
29
-
30
-
31
-
32
-
33
-
34
-
35
-
36
-
37
-
38
-
39
-
40
-
41
-
42
-
43
-
44
-
45
-
46
-
 47
47 -
 48
48 -
 49
49 -
 50
50 -
 51
51 -
 52
52 -
 53
53 -
 54
54 -
 55
55 -
 56
56 -
 57
57 -
 58
58 -
 59
59 -
 60
60 -
 61
61 -
 62
62 -
 63
63 -
 64
64 -
 65
65 -
 66
66 -
 67
67 -
68
-
69
-
70
-
71
-
72
-
73
-
74
-
75
-
76
-
77
-
78
-
79
-
80
-
81
-
82
-
83
-
84
-
85
-
86
-
87
-
88
-
89
-
90
-
91
-
92
-
93
-
94
-
95
-
96
-
97
-
98
-
99
-
100
-
101
-
102
-
103
-
104
-
105
-
106
-
107
-
108
-
109
-
110
-
111
-
112
-
113
-
114
-
115
-
116
-
117
-
118
-
119
-
120
-
121
-
122
-
123
-
124
-
125
-
126
 |
 |

Table of Contents
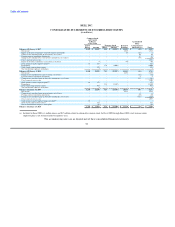
DELL INC.
CONSOLIDATED STATEMENTS OF STOCKHOLDERS' EQUITY
(in millions)
Common Stock
and Capital
in Excess Accumulated
of Par Value Other
Issued Treasury Stock Retained Comprehensive
Shares Amount Shares Amount Earnings Income/(Loss) Total
Balances at February 2, 2007 3,307 $ 10,107 606 $ (21,033) $ 15,282 $ (28) $ 4,328
Net income - - - - 2,947 - 2,947
Impact of adoption of guidance on hybrid financial instruments - - - - 29 (23) 6
Change in net unrealized gain on investments, net of taxes - - - - - 56 56
Foreign currency translation adjustments - - - - - 17 17
Change in net unrealized loss on derivative instruments, net of taxes - - - - - (38) (38)
Total comprehensive income - - - - - - 2,988
Impact of adoption of guidance on uncertain tax positions - (3) - - (59) - (62)
Stock issuances under employee plans(a) 13 153 - - - - 153
Repurchases - - 179 (4,004) - - (4,004)
Stock-based compensation expense - 329 - - - - 329
Tax benefit from employee stock plans - 3 - - - - 3
Balances at February 1, 2008 3,320 10,589 785 (25,037) 18,199 (16) 3,735
Net income - - - - 2,478 - 2,478
Change in net unrealized loss on investments, net of taxes - - - - - (29) (29)
Foreign currency translation adjustments - - - - - 5 5
Change in net unrealized gain on derivative instruments, net of taxes - - - - - 349 349
Total comprehensive income - - - - - - 2,803
Stock issuances under employee plans(a) 18 173 - - - - 173
Repurchases - - 134 (2,867) - - (2,867)
Stock-based compensation expense - 419 - - - - 419
Tax benefit from employee stock plans - 8 - - - - 8
Balances at January 30, 2009 3,338 11,189 919 (27,904) 20,677 309 4,271
Net income - - - - 1,433 - 1,433
Change in net unrealized gain on investments, net of taxes - - - - - 6 6
Foreign currency translation adjustments - - - - - (29) (29)
Change in net unrealized gain on derivative instruments, net of taxes - - - - - (323) (323)
Total comprehensive income - - - - - - 1,087
Stock issuances under employee plans and other(a) 13 3 - - - - 3
Stock-based compensation expense - 312 - - - - 312
Net tax shortfall from employee stock plans - (32) - - - - (32)
Balances at January 29, 2010 3,351 $ 11,472 919 $ (27,904) $ 22,110 $ (37) $ 5,641
(a) Included in Fiscal 2008 is 1 million shares and $17 million related to redeemable common stock. In Fiscal 2008 through Fiscal 2010, stock issuance under
employee plans is net of shares held for employee taxes.
The accompanying notes are an integral part of these consolidated financial statements.
53