Dell 2004 Annual Report Download - page 58
Download and view the complete annual report
Please find page 58 of the 2004 Dell annual report below. You can navigate through the pages in the report by either clicking on the pages listed below, or by using the keyword search tool below to find specific information within the annual report.-
 1
1 -
2
-
3
-
4
-
5
-
6
-
7
-
8
-
9
-
10
-
11
-
12
-
13
-
14
-
15
-
16
-
17
-
18
-
19
-
20
-
21
-
22
-
23
-
24
-
25
-
26
-
27
-
28
-
29
-
30
-
31
-
32
-
33
-
34
-
35
-
36
-
37
-
38
-
39
-
40
-
41
-
42
-
43
-
44
-
45
-
46
-
47
-
 48
48 -
 49
49 -
 50
50 -
 51
51 -
 52
52 -
 53
53 -
 54
54 -
 55
55 -
 56
56 -
 57
57 -
 58
58 -
 59
59 -
 60
60 -
 61
61 -
 62
62 -
 63
63 -
 64
64 -
 65
65 -
 66
66 -
 67
67 -
 68
68 -
69
-
70
-
71
-
72
-
73
-
74
-
75
-
76
-
77
-
78
-
79
-
80
 |
 |
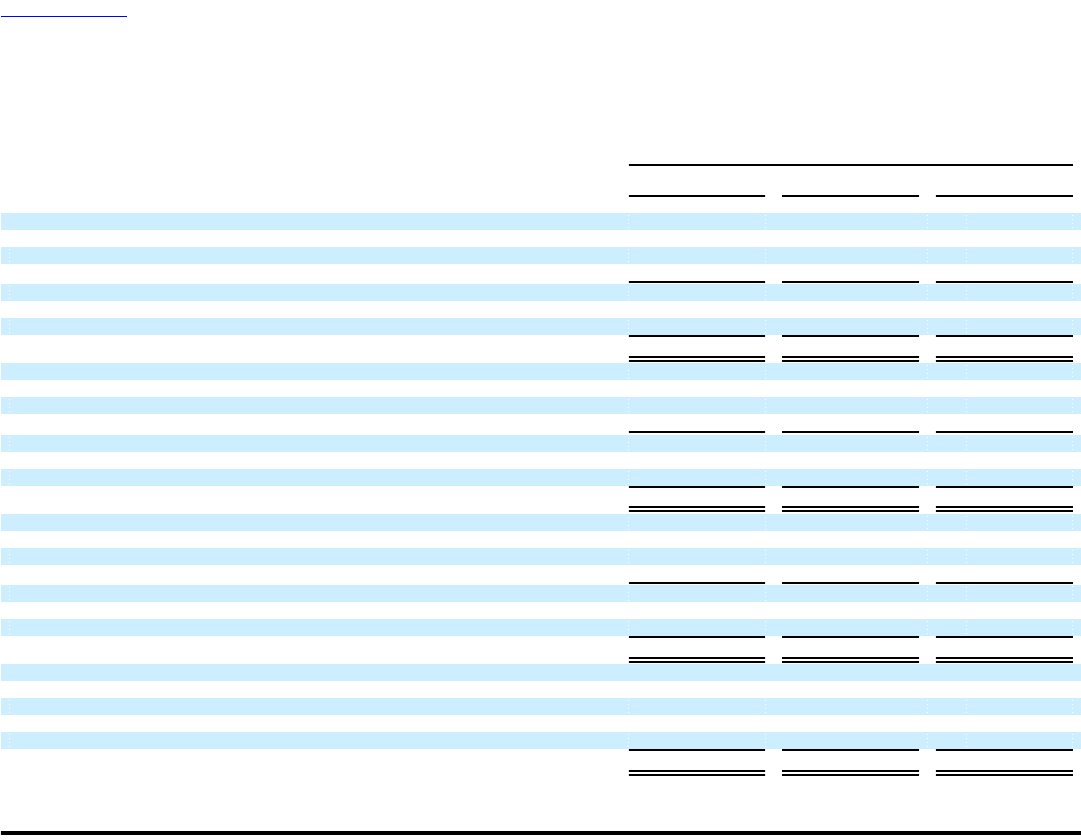
Table of Contents
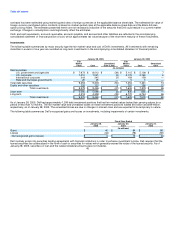
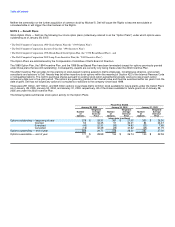
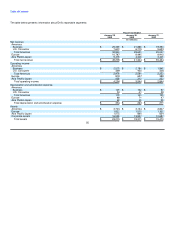
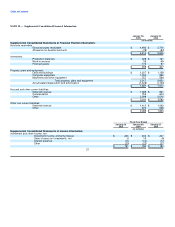
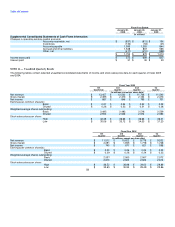
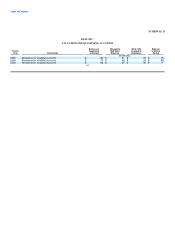
The table below presents information about Dell's reportable segments:
Fiscal Year Ended
January 28, January 30, January 31,
2005 2004 2003
(in millions)
Net revenue
Americas:
Business $ 25,339 $ 21,888 $ 19,394
U.S. Consumer 7,601 6,715 5,653
Total Americas 32,940 28,603 25,047
Europe 10,787 8,495 6,912
Asia Pacific-Japan 5,478 4,346 3,445
Total net revenue $ 49,205 $ 41,444 $ 35,404
Operating income
Americas:
Business $ 2,579 $ 2,194 $ 1,945
U.S. Consumer 399 400 308
Total Americas 2,978 2,594 2,253
Europe 818 637 388
Asia Pacific-Japan 458 313 203
Total operating income $ 4,254 $ 3,544 $ 2,844
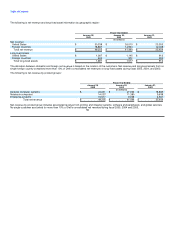
Depreciation and amortization expense
Americas:
Business $ 125 $ 102 $ 97
U.S. Consumer 53 41 38
Total Americas 178 143 135
Europe 88 71 47
Asia Pacific-Japan 68 49 29
Total depreciation and amortization expense $ 334 $ 263 $ 211
Assets
Americas $ 3,724 $ 3,134 $ 2,847
Europe 1,817 1,510 1,302
Asia Pacific-Japan 1,075 860 634
Corporate assets 16,599 13,807 10,687
Total assets $ 23,215 $ 19,311 $ 15,470
55