Dell 2004 Annual Report Download - page 40
Download and view the complete annual report
Please find page 40 of the 2004 Dell annual report below. You can navigate through the pages in the report by either clicking on the pages listed below, or by using the keyword search tool below to find specific information within the annual report.-
 1
1 -
2
-
3
-
4
-
5
-
6
-
7
-
8
-
9
-
10
-
11
-
12
-
13
-
14
-
15
-
16
-
17
-
18
-
19
-
20
-
21
-
22
-
23
-
24
-
25
-
26
-
27
-
28
-
29
-
 30
30 -
 31
31 -
 32
32 -
 33
33 -
 34
34 -
 35
35 -
 36
36 -
 37
37 -
 38
38 -
 39
39 -
 40
40 -
 41
41 -
 42
42 -
 43
43 -
 44
44 -
 45
45 -
 46
46 -
 47
47 -
 48
48 -
 49
49 -
 50
50 -
51
-
52
-
53
-
54
-
55
-
56
-
57
-
58
-
59
-
60
-
61
-
62
-
63
-
64
-
65
-
66
-
67
-
68
-
69
-
70
-
71
-
72
-
73
-
74
-
75
-
76
-
77
-
78
-
79
-
80
 |
 |

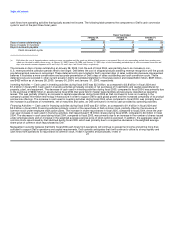
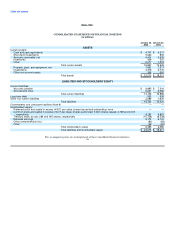
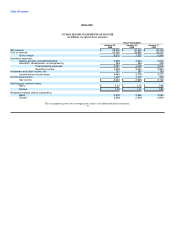
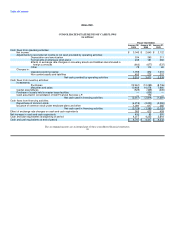
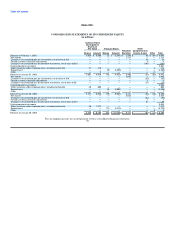
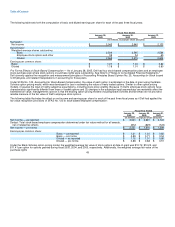
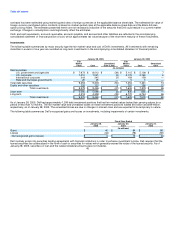
Table of Contents
DELL INC.
CONSOLIDATED STATEMENTS OF INCOME
(in millions, except per share amounts)
Fiscal Year Ended
January 28, January 30, January 31,
2005 2004 2003
Net revenue $ 49,205 $ 41,444 $ 35,404
Cost of revenue 40,190 33,892 29,055
Gross margin 9,015 7,552 6,349
Operating expenses:
Selling, general, and administrative 4,298 3,544 3,050
Research, development, and engineering 463 464 455
Total operating expenses 4,761 4,008 3,505
Operating income 4,254 3,544 2,844
Investment and other income, net 191 180 183
Income before income taxes 4,445 3,724 3,027
Income tax provision 1,402 1,079 905
Net income $ 3,043 $ 2,645 $ 2,122
Earnings per common share:
Basic $ 1.21 $ 1.03 $ 0.82
Diluted $ 1.18 $ 1.01 $ 0.80
Weighted average shares outstanding:
Basic 2,509 2,565 2,584
Diluted 2,568 2,619 2,644
The accompanying notes are an integral part of these consolidated financial statements.
37