Dell 2004 Annual Report Download - page 29
Download and view the complete annual report
Please find page 29 of the 2004 Dell annual report below. You can navigate through the pages in the report by either clicking on the pages listed below, or by using the keyword search tool below to find specific information within the annual report.-
 1
1 -
2
-
3
-
4
-
5
-
6
-
7
-
8
-
9
-
10
-
11
-
12
-
13
-
14
-
15
-
16
-
17
-
18
-
 19
19 -
 20
20 -
 21
21 -
 22
22 -
 23
23 -
 24
24 -
 25
25 -
 26
26 -
 27
27 -
 28
28 -
 29
29 -
 30
30 -
 31
31 -
 32
32 -
 33
33 -
 34
34 -
 35
35 -
 36
36 -
 37
37 -
 38
38 -
 39
39 -
40
-
41
-
42
-
43
-
44
-
45
-
46
-
47
-
48
-
49
-
50
-
51
-
52
-
53
-
54
-
55
-
56
-
57
-
58
-
59
-
60
-
61
-
62
-
63
-
64
-
65
-
66
-
67
-
68
-
69
-
70
-
71
-
72
-
73
-
74
-
75
-
76
-
77
-
78
-
79
-
80
 |
 |
Table of Contents
Liquidity, Capital Commitments, and Contractual Cash Obligations
Liquidity
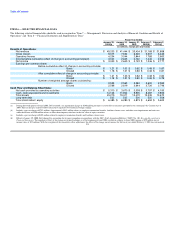
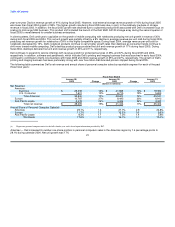
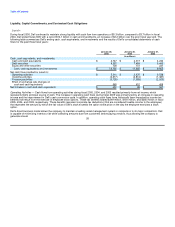
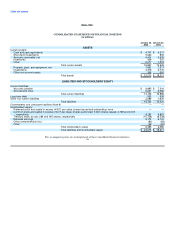
During fiscal 2005, Dell continued to maintain strong liquidity with cash flow from operations of $5.3 billion, compared to $3.7 billion in fiscal
2004. Dell ended fiscal 2005 with a record $14.1 billion in cash and investments, an increase of $2.2 billion over the prior fiscal year end. The
following table summarizes Dell's ending cash, cash equivalents, and investments and the results of Dell's consolidated statements of cash
flows for the past three fiscal years:
January 28, January 30, January 31,
2005 2004 2003
(in millions)
Cash, cash equivalents, and investments:
Cash and cash equivalents $ 4,747 $ 4,317 $ 4,232
Debt securities 9,253 7,454 5,442
Equity and other securities 126 151 231
Cash, cash equivalents and investments $ 14,126 $ 11,922 $ 9,905
Net cash flow provided by (used in):
Operating activities $ 5,310 $ 3,670 $ 3,538
Investing activities (2,317) (2,814) (1,381)
Financing activities (3,128) (1,383) (2,025)
Effect of exchange rate changes on
cash and cash equivalents 565 612 459
Net increase in cash and cash equivalents $ 430 $ 85 $ 591
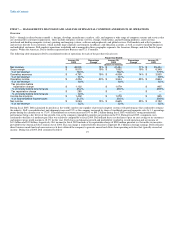
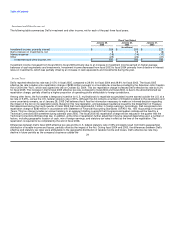
Operating Activities — Cash flows from operating activities during fiscal 2005, 2004, and 2003 resulted primarily from net income, which
represents Dell's principal source of cash. The increase in operating cash flows during fiscal 2005 was primarily led by an increase in operating
income and the improvement in Dell's cash conversion cycle. In addition, operating cash flows have historically been impacted by income tax
benefits that result from the exercise of employee stock options. These tax benefits totaled $249 million, $181 million, and $260 million in fiscal
2005, 2004, and 2003, respectively. These benefits represent corporate tax deductions (that are considered taxable income to the employee)
that represent the amount by which the fair value of Dell's stock exceeds the option strike price on the day the employee exercises a stock
option.
Dell's direct business model allows the company to maintain a leading asset management system in comparison to its major competitors. Dell
is capable of minimizing inventory risk while collecting amounts due from customers before paying vendors, thus allowing the company to
generate annual 26