Dell 2004 Annual Report Download - page 41
Download and view the complete annual report
Please find page 41 of the 2004 Dell annual report below. You can navigate through the pages in the report by either clicking on the pages listed below, or by using the keyword search tool below to find specific information within the annual report.-
 1
1 -
2
-
3
-
4
-
5
-
6
-
7
-
8
-
9
-
10
-
11
-
12
-
13
-
14
-
15
-
16
-
17
-
18
-
19
-
20
-
21
-
22
-
23
-
24
-
25
-
26
-
27
-
28
-
29
-
30
-
 31
31 -
 32
32 -
 33
33 -
 34
34 -
 35
35 -
 36
36 -
 37
37 -
 38
38 -
 39
39 -
 40
40 -
 41
41 -
 42
42 -
 43
43 -
 44
44 -
 45
45 -
 46
46 -
 47
47 -
 48
48 -
 49
49 -
 50
50 -
 51
51 -
52
-
53
-
54
-
55
-
56
-
57
-
58
-
59
-
60
-
61
-
62
-
63
-
64
-
65
-
66
-
67
-
68
-
69
-
70
-
71
-
72
-
73
-
74
-
75
-
76
-
77
-
78
-
79
-
80
 |
 |

Table of Contents
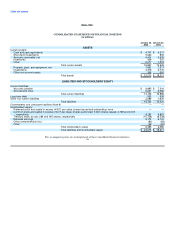
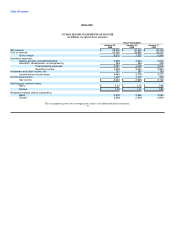
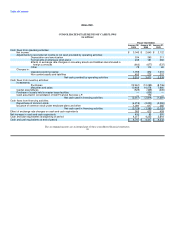
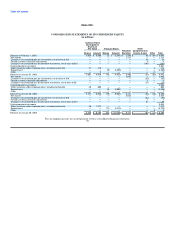
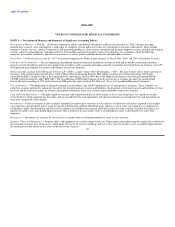
DELL INC.
CONSOLIDATED STATEMENTS OF CASH FLOWS
(in millions)
Fiscal Year Ended
January 28, January 30, January 31,
2005 2004 2003
Cash flows from operating activities:
Net income $ 3,043 $ 2,645 $ 2,122
Adjustments to reconcile net income to net cash provided by operating activities:
Depreciation and amortization 334 263 211
Tax benefits of employee stock plans 249 181 260
Effects of exchange rate changes on monetary assets and liabilities denominated in
foreign currencies (602) (677) (537)
Other 78 113 60
Changes in:
Operating working capital 1,755 872 1,210
Non-current assets and liabilities 453 273 212
Net cash provided by operating activities 5,310 3,670 3,538
Cash flows from investing activities:
Investments:
Purchases (12,261) (12,099) (8,736)
Maturities and sales 10,469 10,078 7,660
Capital expenditures (525) (329) (305)
Purchase of assets held in master lease facilities — (636) —
Cash assumed in consolidation of Dell Financial Services L.P. — 172 —
Net cash used in investing activities (2,317) (2,814) (1,381)
Cash flows from financing activities:
Repurchase of common stock (4,219) (2,000) (2,290)
Issuance of common stock under employee plans and other 1,091 617 265
Net cash used in financing activities (3,128) (1,383) (2,025)
Effect of exchange rate changes on cash and cash equivalents 565 612 459
Net increase in cash and cash equivalents 430 85 591
Cash and cash equivalents at beginning of period 4,317 4,232 3,641
Cash and cash equivalents at end of period $ 4,747 $ 4,317 $ 4,232
The accompanying notes are an integral part of these consolidated financial statements.
38