Dell 2004 Annual Report Download - page 22
Download and view the complete annual report
Please find page 22 of the 2004 Dell annual report below. You can navigate through the pages in the report by either clicking on the pages listed below, or by using the keyword search tool below to find specific information within the annual report.-
 1
1 -
2
-
3
-
4
-
5
-
6
-
7
-
8
-
9
-
10
-
11
-
 12
12 -
 13
13 -
 14
14 -
 15
15 -
 16
16 -
 17
17 -
 18
18 -
 19
19 -
 20
20 -
 21
21 -
 22
22 -
 23
23 -
 24
24 -
 25
25 -
 26
26 -
 27
27 -
 28
28 -
 29
29 -
 30
30 -
 31
31 -
 32
32 -
33
-
34
-
35
-
36
-
37
-
38
-
39
-
40
-
41
-
42
-
43
-
44
-
45
-
46
-
47
-
48
-
49
-
50
-
51
-
52
-
53
-
54
-
55
-
56
-
57
-
58
-
59
-
60
-
61
-
62
-
63
-
64
-
65
-
66
-
67
-
68
-
69
-
70
-
71
-
72
-
73
-
74
-
75
-
76
-
77
-
78
-
79
-
80
 |
 |

Table of Contents
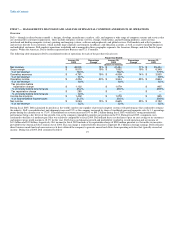
ITEM 7 — MANAGEMENT'S DISCUSSION AND ANALYSIS OF FINANCIAL CONDITION AND RESULTS OF OPERATIONS
Overview
Dell — through its direct business model — designs, develops, manufactures, markets, sells, and supports a wide range of computer systems and services that
are customized to customer requirements. These include enterprise systems (servers, storage, workstations, and networking products), client systems
(notebook and desktop computer systems), printing and imaging systems, software and peripherals, and global services. Dell markets and sells its products
and services directly to its customers, which include large corporate, government, healthcare, and education accounts, as well as small-to-medium businesses
and individual customers. Dell conducts operations worldwide and is managed in three geographic segments: the Americas, Europe, and Asia Pacific-Japan
regions. Within the Americas, Dell is further segmented into Business and U.S. Consumer.
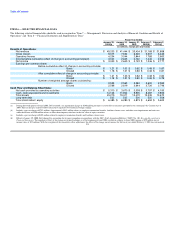
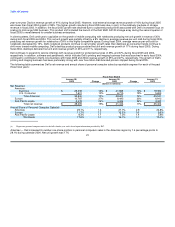
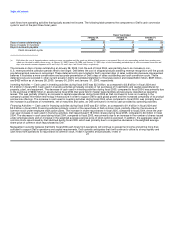
The following table summarizes Dell's consolidated results of operations for each of the past three fiscal years:
Fiscal Year Ended
January 28, Percentage January 30, Percentage January 31,
2005 Change 2004 Change 2003
(dollars in millions)
Net revenue $ 49,205 19% $ 41,444 17% $ 35,404
Gross margin $ 9,015 19% $ 7,552 19% $ 6,349
% of net revenue 18.3% 18.2% 17.9%
Operating expenses $ 4,761 19% $ 4,008 14% $ 3,505
% of net revenue 9.7% 9.7% 9.9%
Operating income $ 4,254 20% $ 3,544 25% $ 2,844
% of net revenue 8.6% 8.6% 8.0%
Tax provision before
repatriation charge $ 1,122 $ 1,079 $ 905
% of income before income taxes 25.2% 29.0% 29.9%
Tax repatriation charge $ 280 $ — $ —
% of income before income taxes 6.3% — —
Income tax provision $ 1,402 $ 1,079 $ 905
% of income before income taxes 31.5% 29.0% 29.9%
Net income $ 3,043 15% $ 2,645 25% $ 2,122
% of net revenue 6.2% 6.4% 6.0%
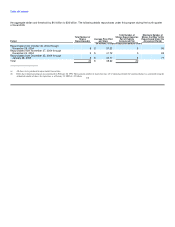
During fiscal 2005, Dell maintained its position as the world's number one supplier of personal computer systems with performance that continued to outpace
the industry. Dell's consolidated net unit shipments increased 21% as the company increased its share of worldwide personal computer sales by 1.1 percentage
points during the calendar year to 17.8%. Consolidated net revenue increased 19% to $49.2 billion during fiscal 2005, with Dell's strong international
performance being a key driver of this growth even as the company expanded its number one position in the U.S. During fiscal 2005, component costs
continued to decline at a moderate pace that was relatively comparable to fiscal 2004. Dell utilized these cost declines to pass on cost savings to its customers
and improve gross profit margin to 18.3% for the year. Dell's focus on balancing growth and profitability resulted in record operating and net income of
$4.3 billion and $3.0 billion, respectively. Net income for fiscal 2005 includes a tax repatriation charge of $280 million pursuant to a favorable tax incentive
provided by the American Jobs Creation Act of 2004. This tax charge is related to Dell's decision to repatriate $4.1 billion in foreign earnings. Dell's efficient
direct business model and cash conversion cycle have allowed the company to generate annual cash flows from operating activities that typically exceed net
income. During fiscal 2005, Dell continued to deliver 19