Columbia Sportswear 2011 Annual Report Download - page 71
Download and view the complete annual report
Please find page 71 of the 2011 Columbia Sportswear annual report below. You can navigate through the pages in the report by either clicking on the pages listed below, or by using the keyword search tool below to find specific information within the annual report.-
 1
1 -
2
-
3
-
4
-
5
-
6
-
7
-
8
-
9
-
10
-
11
-
12
-
13
-
14
-
15
-
16
-
17
-
18
-
19
-
20
-
21
-
22
-
23
-
24
-
25
-
26
-
27
-
28
-
29
-
30
-
31
-
32
-
33
-
34
-
35
-
36
-
37
-
38
-
39
-
40
-
41
-
42
-
43
-
44
-
45
-
46
-
47
-
48
-
49
-
50
-
51
-
52
-
53
-
54
-
55
-
56
-
57
-
58
-
59
-
60
-
 61
61 -
 62
62 -
 63
63 -
 64
64 -
 65
65 -
 66
66 -
 67
67 -
 68
68 -
 69
69 -
 70
70 -
 71
71 -
 72
72 -
 73
73 -
 74
74 -
 75
75 -
 76
76 -
 77
77 -
 78
78 -
 79
79 -
 80
80 -
 81
81 -
82
-
83
-
84
-
85
-
86
 |
 |

COLUMBIA SPORTSWEAR COMPANY
NOTES TO CONSOLIDATED FINANCIAL STATEMENTS—(Continued)
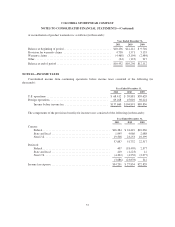
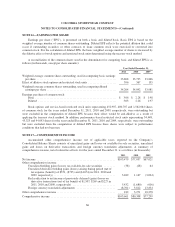
NOTE 16—EARNINGS PER SHARE
Earnings per share (“EPS”),is presented on both a basic and diluted basis. Basic EPS is based on the
weighted average number of common shares outstanding. Diluted EPS reflects the potential dilution that could
occur if outstanding securities or other contracts to issue common stock were exercised or converted into
common stock. For the calculation of diluted EPS, the basic weighted average number of shares is increased by
the dilutive effect of stock options and restricted stock units determined using the treasury stock method.
A reconciliation of the common shares used in the denominator for computing basic and diluted EPS is as
follows (in thousands, except per share amounts):
Year Ended December 31,
2011 2010 2009
Weighted average common shares outstanding, used in computing basic earnings
per share ........................................................ 33,808 33,725 33,846
Effect of dilutive stock options and restricted stock units .................... 396 367 135
Weighted-average common shares outstanding, used in computing diluted
earnings per share ................................................. 34,204 34,092 33,981
Earnings per share of common stock:
Basic ......................................................... $ 3.06 $ 2.28 $ 1.98
Diluted ....................................................... 3.03 2.26 1.97
Stock options and service-based restricted stock units representing 452,907, 480,707 and 1,562,064 shares
of common stock for the years ended December 31, 2011, 2010 and 2009, respectively, were outstanding but
were excluded in the computation of diluted EPS because their effect would be anti-dilutive as a result of
applying the treasury stock method. In addition, performance-based restricted stock units representing 34,448,
43,323 and 44,043 shares for the years ended December 31, 2011, 2010 and 2009, respectively, were outstanding
but were excluded from the computation of diluted EPS because these shares were subject to performance
conditions that had not been met.
NOTE 17—COMPREHENSIVE INCOME
Accumulated other comprehensive income, net of applicable taxes, reported on the Company’s
Consolidated Balance Sheets consists of unrealized gains and losses on available-for-sale securities, unrealized
gains and losses on derivative transactions and foreign currency translation adjustments. A summary of
comprehensive income, net of related tax effects, for the years ended December 31, is as follows (in thousands):
2011 2010 2009
Net income ....................................................... $103,479 $77,037 $67,021
Other comprehensive income:
Unrealized holding gains (losses) on available-for-sale securities ........ (38) (28) 64
Unrealized derivative holding gains (losses) arising during period (net of
tax expense (benefit)) of $351, ($725) and ($1,054) in 2011, 2010 and
2009, respectively) ........................................... 3,489 1,167 (3,024)
Reclassification to net income of previously deferred (gains) losses on
derivative transactions (net of tax benefit of $1,507, $269 and $227 in
2011, 2010 and 2009, respectively) .............................. 5,432 (1,680) (616)
Foreign currency translation adjustments ........................... (8,701) 3,812 13,854
Other comprehensive income ......................................... 182 3,271 10,278
Comprehensive income ............................................. $103,661 $80,308 $77,299
66