Columbia Sportswear 2011 Annual Report Download - page 36
Download and view the complete annual report
Please find page 36 of the 2011 Columbia Sportswear annual report below. You can navigate through the pages in the report by either clicking on the pages listed below, or by using the keyword search tool below to find specific information within the annual report.-
 1
1 -
2
-
3
-
4
-
5
-
6
-
7
-
8
-
9
-
10
-
11
-
12
-
13
-
14
-
15
-
16
-
17
-
18
-
19
-
20
-
21
-
22
-
23
-
24
-
25
-
 26
26 -
 27
27 -
 28
28 -
 29
29 -
 30
30 -
 31
31 -
 32
32 -
 33
33 -
 34
34 -
 35
35 -
 36
36 -
 37
37 -
 38
38 -
 39
39 -
 40
40 -
 41
41 -
 42
42 -
 43
43 -
 44
44 -
 45
45 -
 46
46 -
47
-
48
-
49
-
50
-
51
-
52
-
53
-
54
-
55
-
56
-
57
-
58
-
59
-
60
-
61
-
62
-
63
-
64
-
65
-
66
-
67
-
68
-
69
-
70
-
71
-
72
-
73
-
74
-
75
-
76
-
77
-
78
-
79
-
80
-
81
-
82
-
83
-
84
-
85
-
86
 |
 |

Year Ended December 31, 2011 Compared to Year Ended December 31, 2010
Net Sales: Consolidated net sales increased $210.5 million, or 14%, to $1,694.0 million in 2011 from
$1,483.5 million in 2010. Net sales increased across all geographic regions, in each product category and across
all major brands. Changes in foreign currency exchange rates compared with 2010 contributed approximately
three percentage points of benefit to the consolidated net sales comparison.
Sales by Geographic Region
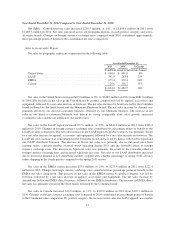
Net sales by geographic region are summarized in the following table:
Year Ended December 31,
2011 2010 % Change
(In millions, except for percentage changes)
United States ........................................ $ 948.0 $ 881.0 8%
LAAP .............................................. 341.0 263.4 29%
EMEA ............................................. 275.4 222.4 24%
Canada ............................................. 129.6 116.7 11%
$1,694.0 $1,483.5 14%
Net sales in the United States increased $67.0 million, or 8%, to $948.0 million in 2011 from $881.0 million
in 2010. The increase in net sales in the United States by product category was led by apparel, accessories and
equipment, followed by a net sales increase in footwear. The net sales increase by brand was led by the Columbia
brand, followed by the Sorel brand and the Mountain Hardwear brand. The net sales increase by channel was
primarily driven by our direct-to-consumer business, followed by our wholesale business. The increase in net
sales in our direct-to-consumer business was driven by strong comparable store sales growth, increased
e-commerce sales and the net addition of two outlet stores.
Net sales in the LAAP region increased $77.6 million, or 29%, to $341.0 million in 2011 from $263.4
million in 2010. Changes in foreign currency exchange rates contributed six percentage points of benefit to the
LAAP net sales comparison. The net sales increase in the LAAP region by product category was primarily driven
by a net sales increase in apparel, accessories and equipment, followed by a net sales increase in footwear. The
LAAP net sales increase was concentrated in the Columbia brand and was led by Korea, followed by Japan and
our LAAP distributor business. The increase in Korea net sales was primarily due to increased sales from
existing stores, a greater number of retail stores operating during 2011 and the favorable effect of foreign
currency exchange rates. The increase in Japan net sales was primarily the result of the favorable effect of
foreign currency exchange rates and increased wholesale net sales. Net sales to our LAAP distributors increased
due to increased demand in key distributor markets coupled with a higher percentage of spring 2012 advance
orders shipping in the fourth quarter compared to the spring 2011 season.
Net sales in the EMEA region increased $53.0 million, or 24%, to $275.4 million in 2011 from $222.4
million in 2010. Changes in foreign currency exchange rates contributed four percentage points of benefit to the
EMEA net sales comparison. The increase in net sales in the EMEA region by product category was led by
footwear, followed by a net sales increase in apparel, accessories and equipment. The net sales increase by
channel was led by our EMEA direct business, followed by our EMEA distributors. The increase in EMEA direct
net sales was primarily driven by the Sorel brand, followed by the Columbia brand.
Net sales in Canada increased $12.9 million, or 11%, to $129.6 million in 2011 from $116.7 million in
2010. Changes in foreign currency exchange rates compared to 2010 contributed six percentage points of benefit
to the Canada net sales comparison. By product category, the increase in net sales was led by apparel, accessories
31